Visualization
Plotting Ocean Transects
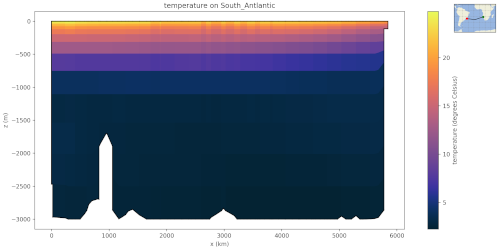
The function mpas_tools.ocean.viz.plot_ocean_transects() and the
associated plot_ocean_transects command-line tool can be used to plot
transects of various MPAS-Ocean variables. The arguments to the command-line
tool are:
$ plot_ocean_transects --help
usage: plot_ocean_transects [-h] -g GEOJSON_FILENAME [-m MESH_FILENAME] -f
                            FILENAME [-v VARIABLE_LIST [VARIABLE_LIST ...]]
                            [-c COLORMAP] [--flip]

options:
  -h, --help            show this help message and exit
  -g GEOJSON_FILENAME, --geojson GEOJSON_FILENAME
                        A geojson file with transects to plot
  -m MESH_FILENAME, --mesh MESH_FILENAME
                        An MPAS-Ocean mesh file.  If not specified, the MPAS-Ocean data file must contain the mesh.
  -f FILENAME, --file FILENAME
                        An MPAS-Ocean data file
  -v VARIABLE_LIST [VARIABLE_LIST ...], --variable_list VARIABLE_LIST [VARIABLE_LIST ...]
                        List of variables to plot.  All variables on cells in the data file is the default.
  -c COLORMAP, --colormap COLORMAP
                        A colormap to use for the plots, default depends on the field name.
  --flip                Flip the x axis for all transects
See transects
from geometric_features for a examples of what a geojson transect might
look like:
{
    "type": "FeatureCollection",
    "features": [
        {
            "type": "Feature",
            "properties": {
                "name": "Drake Passage",
                "object": "transect",
                "component": "ocean",
                "author": "Mark Petersen, Xylar Asay-Davis, Milena Veneziani",
            },
            "geometry": {
                "type": "LineString",
                "coordinates": [
                    [
                        -63.02,
                        -65.46
                    ],
                    [
                        -63.81,
                        -63.8
                    ],
                    [
                        -64.42,
                        -62.02
                    ],
                    [
                        -65.04,
                        -60.25
                    ],
                    [
                        -65.74,
                        -58.28
                    ],
                    [
                        -66.37,
                        -56.39
                    ],
                    [
                        -67.02,
                        -54.44
                    ]
                ]
            }
        }
    ]
}
Add more features to the features list to plot multiple transects at the
same time.
The MPAS-Ocean mesh file must including not just the horizontal mesh variables
but also the vertical mesh variables (minLevelCell, maxLevelCell,
layerThickness, etc.)
If you don’t specify the list of variables to plot, all variables with
dimensions nCells and nVertLevels will be plotted.
One way of customizing these visualizaitons is to make your own copy of
transects.py
and change _plot_transect() to suite your needs, (changing figure size, dpi,
colorbar, etc.)