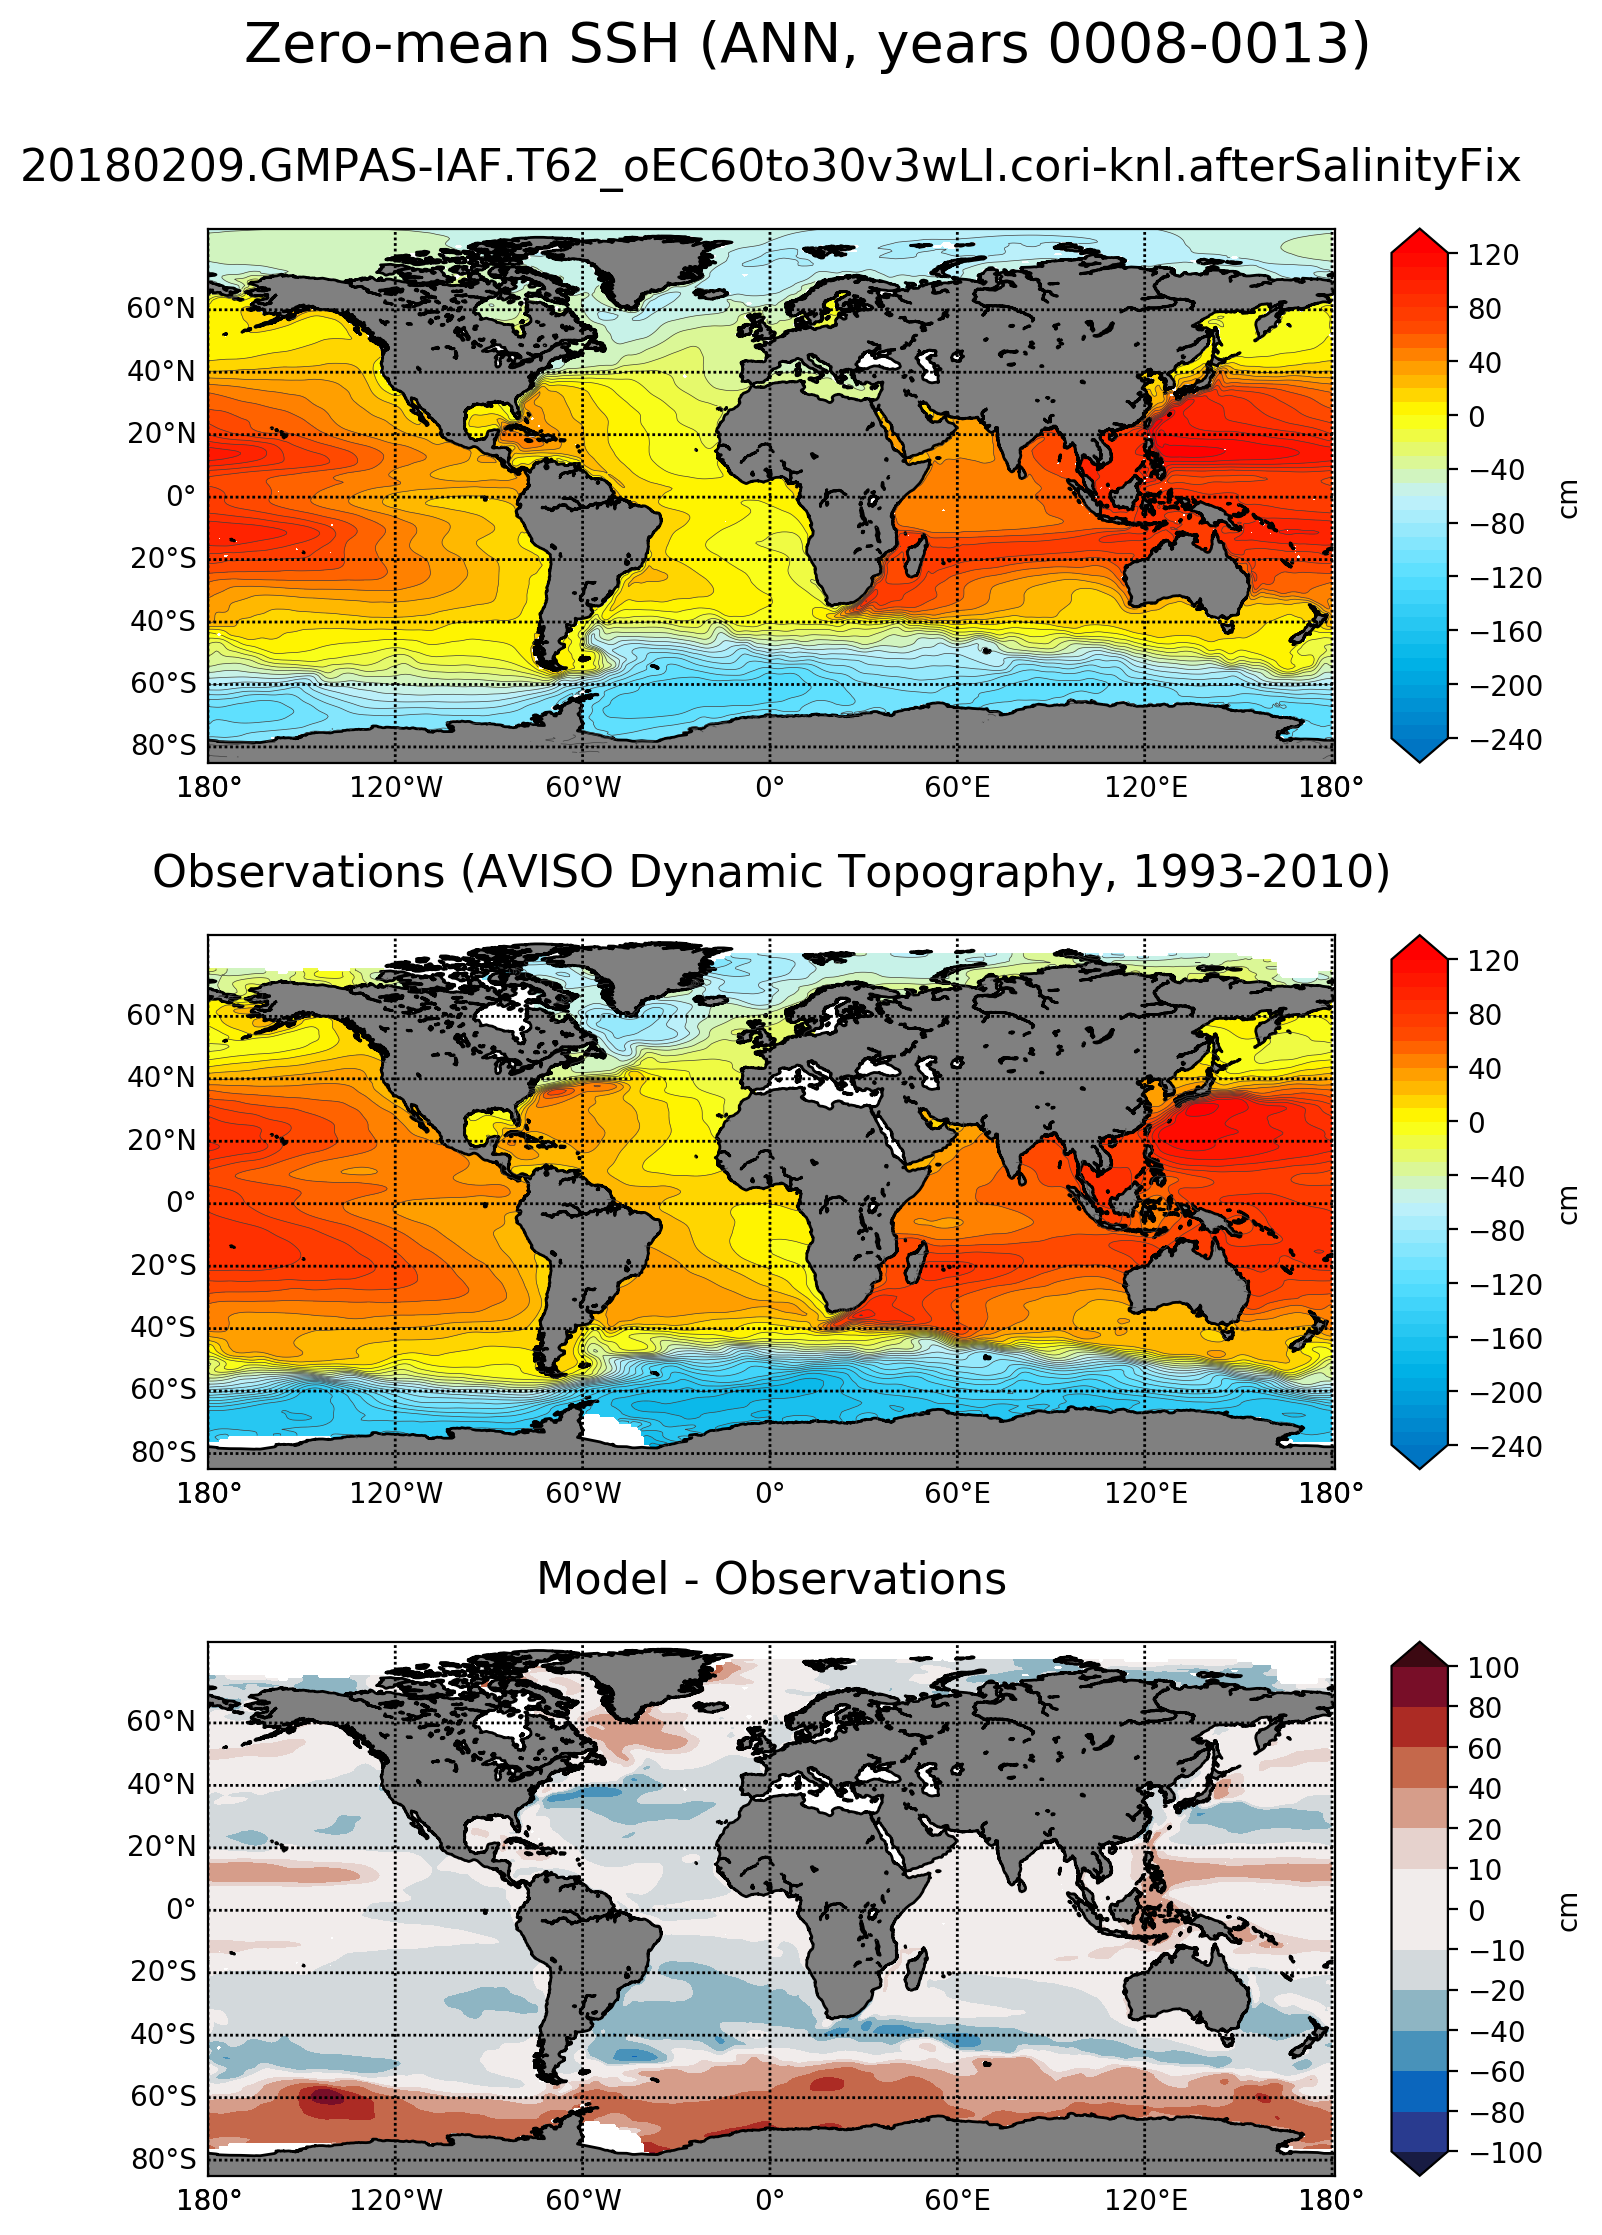
climatologyMapSSH
An analysis task for comparison of global maps of sea surface height (SSH) with zero mean against observations. The mean has been subtracted because the initial sea level is somewhat arbitrary and will lead to a systematic offset when compared with the observations.
Component and Tags:
component: ocean
tags: climatology, horizontalMap, ssh, publicObs
Configuration Options
The following configuration options are available for this task:
[climatologyMapSSH]
## options related to plotting horizontally remapped climatologies of
## sea surface height (SSH) against reference model results and observations

# colormap for model/observations
colormapNameResult = Maximenko
# color indices into colormapName for filled contours
colormapIndicesResult = numpy.array(numpy.linspace(0, 255, 38), int)
# colormap levels/values for contour boundaries
colorbarLevelsResult = numpy.arange(-240., 130., 10.)
# colormap levels/values for ticks (defaults to same as levels)
colorbarTicksResult = numpy.arange(-240., 160., 40.)

# contour line levels
contourLevelsResult = numpy.arange(-240., 130., 10.)
# contour line thickness
contourThicknessResult = 0.25
# contour color
contourColorResult = 0.25

# colormap for differences
colormapNameDifference = balance
# color indices into colormapName for filled contours
colormapIndicesDifference = [0, 23, 46, 70, 93, 116, 128, 128, 139, 162, 185,
                             209, 232, 255]
# colormap levels/values for contour boundaries
colorbarLevelsDifference = [-100., -80., -60., -40., -20., -10., 0., 10.,
                            20.,  40.,  60.,  80.,  100.]

# Months or seasons to plot (Jan, Feb, Mar, Apr, May, Jun, Jul, Aug, Sep, Oct,
# Nov, Dec, JFM, AMJ, JAS, OND, ANN)
seasons =  ['JFM', 'JAS', 'ANN']

# comparison grid(s) ('latlon', 'antarctic') on which to plot analysis
comparisonGrids = ['latlon']
- For more details, see:
Note
The color map and contours for these plots were inspired by Fig. 1 from Maximenko et al. (2009)
Observations
Example Result
