Colormaps
Each analysis task that includes plots with colormaps has a series of configuration options that can be used to manipulate the colormap. MPAS-Analysis supports two types of plots, each of which has an associated set of options for configuring its colormap.
Supported Colormaps
MPAS-Analysis supports all matplotlib colormaps, all cmocean colormaps,
all Scientific Colour Map Suite 3.0 colormaps, the selection of key
SciVisColor colormaps and five custom color maps: ferret,
erdc_iceFire_H, erdc_iceFire_L, BuOr and Maximenko.
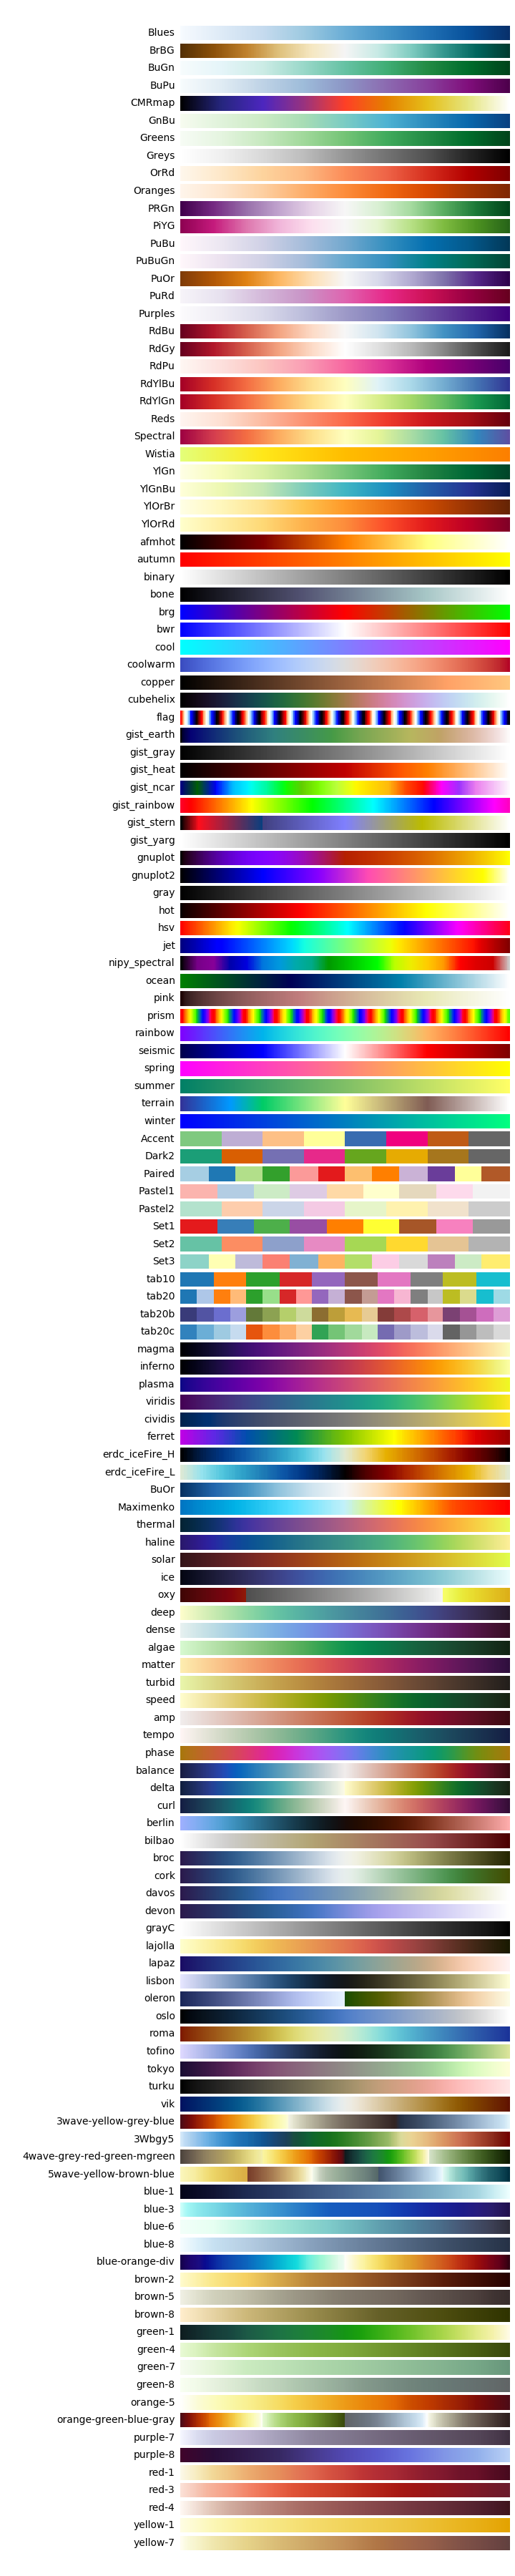
All available colormaps
To plot all availabe colormpas (as above), run:
mpas_analysis --plot_colormaps
Indexed Colormaps
Indexed colormaps are used in association with contour plots in MPAS-Analysis. The following configuration options are associated with an indexed colormap:
# colormap name
colormapName = RdYlBu_r
# color indices into colormapName for filled contours
colormapIndices = [0, 40, 80, 110, 140, 170, 200, 230, 255]
# colormap levels/values for contour boundaries
colorbarLevels = [-2, 0, 2, 6, 10, 16, 22, 26, 28, 32]
The indices are between 0 and 255, indicating the location within the colormap to sample. The levels are the contour values to plot. Since the region between two contours will be filled with a solid color specified by a colormap index, the number of levels is one greater than the number of indices. The exception is when a separate shading should be used for values that fall outside the range of the contours, in which case the number of colormap indices is one more than the number of levels values, and the first and last index are used to specify the “under” and “over” color values.
Continuous Colormaps
A continuous colormap is specified with a different set of options:
# colormap for model/observations
colormapName = erdc_iceFire_H
# the type of norm used in the colormap
normType = symLog
# A dictionary with keywords for the norm
normArgs = {'linthresh': 1., 'linscale': 0.5, 'vmin': -100.,
            'vmax': 100.}
MPAS Analysis supports three norms for the continuous color map, with an associated dictionary of arguments. These are:
See the associated documentaiton for the arguments to each norm.
Colormpas in Three Panel Plots
Many MPAS-Analysis tasks include a panel for the main model run, another for
observations or a control run and a third panel for displaying a bias or the
the model-reference difference. In such cases, we support one colormap for the
first two panels and another for the final panel. Options for each of these
colormaps are specified by appending either Result or Difference to
each. For example:
# colormap for model/observations
colormapNameResult = RdYlBu_r
# color indices into colormapName for filled contours
colormapIndicesResult = [0, 40, 80, 110, 140, 170, 200, 230, 255]
# colormap levels/values for contour boundaries
colorbarLevelsResult = [-2, 0, 2, 6, 10, 16, 22, 26, 28, 32]

# colormap for differences
colormapNameDifference = RdBu_r
# color indices into colormapName for filled contours
colormapIndicesDifference = [0, 28, 57, 85, 113, 128, 128, 142, 170, 198,
                             227, 255]
# colormap levels/values for contour boundaries
colorbarLevelsDifference = [-5, -3, -2, -1, -0.1, 0, 0.1, 1, 2, 3, 5]
Adding Contour Lines
Contour lines can be added to a plot with the following options:
# contour line levels
contourLevels = numpy.arange(-240., 130., 10.)
# contour line thickness
contourThickness = 0.25
# contour color
contourColor = 0.25
The levels are the field values for each contour. The line thickness is
specified in points. The contourColor can be any color name supported
by matplotlib or a floating point number between 0 and 1 specifying a
shade of gray.
Append Result or Difference to these options for a 3-panel plot.
Specifying Colorbar Tick Marks
By default, colorbar tick marks are chosen automatically by matplotlib.
To specify tick marks explicitly, use:
colorbarTicks = [-100., -50., -20., -10., -5., -2., -1., 0., 1., 2., 5.,
                 10., 20., 50., 100.]
Alternatively, numpy functions can be used to specify the tick locations:
colorbarTicks = numpy.linspace(-100, 100, 9)
Again, append Result or Difference to these options for a 3-panel plot.