timeSeriesOceanRegions
An analysis task for plotting time series of of temperature, salinity, potential density and other fields of interest averaged over ocean regions.
Component and Tags:
component: ocean
tags: timeSeries, regions
Configuration Options
The following configuration options are available for this task:
[timeSeriesOceanRegions]
## options related to plotting time series of groups of ocean regions

# the names of region groups to plot, each with its own section below
regionGroups = ['Antarctic Regions']

# the number of threads dask is allowed to spawn for each process computing
# a year of these time series
# Decrease this number if timeSeriesOceanRegions subtasks are running
# out of available threads
daskThreads = 12

# the number of subprocesses that each task gets counted as occupying
# Increase this number if timeSeriesOceanRegions subtasks are running
# out of memory, and fewer tasks will be allowed to run at once
subprocessCount = 3

[timeSeriesAntarcticRegions]
## options related to plotting time series of Antarctic regions

# A geojson file containing Antarctic ocean regions.  Each region must have
# 'zmin' and 'zmax' properites in addition to the usual properies for a region
# in geometric_features
regionMask = 'antarcticRegions.geojson'

# list of regions to plot or ['all'] for all regions in the masks file.
# See "regionNames" in the antarcticRegions masks file in
# regionMaskSubdirectory for details.
regionNames = ['all']

# a list of variables to plot
variables = [{'name': 'temperature',
              'title': 'Temperature',
              'units': '$^\circ$C',
              'mpas': 'timeMonthly_avg_activeTracers_temperature'},
             {'name': 'salinity',
              'title': 'Salinity',
              'units': 'PSU',
              'mpas': 'timeMonthly_avg_activeTracers_salinity'},
             {'name': 'potentialDensity',
              'title': 'Potential Density',
              'units': 'kg m$^{-3}$',
              'mpas': 'timeMonthly_avg_potentialDensity'}]
Region Groups
A list of groups of regions, each of which will get its own gallery group on
the resulting analysis webpage. These can be any name without punctuation.
For each region group, there should be a corresponding
timeSeries<RegionGroup> section of the config file, with any spaces removed
from the name of the region group. By default, the only region group is
“Antarctic Regions”.
Region Mask
The regionMask is a geojson file produce from the geometric_features
packge. It should include any number of ocean regions, each of which includes
properties zmin and zmax. Examples of how to create such a set of
features can be found in antarctic_ocean_regions.
Region Names
The regionNames can be set to ['all'] (the default) to plot all of the
regions in the regionMask file. In the case of “Antarctic Regions”, these
are:
["Southern Ocean", "Southern Ocean 60S", "Eastern Weddell Sea Shelf",
 "Eastern Weddell Sea Deep", "Western Weddell Sea Shelf",
 "Western Weddell Sea Deep", "Weddell Sea Shelf", "Weddell Sea Deep",
 "Bellingshausen Sea Shelf", "Bellingshausen Sea Deep", "Amundsen Sea Shelf",
 "Amundsen Sea Deep", "Eastern Ross Sea Shelf", "Eastern Ross Sea Deep",
 "Western Ross Sea Shelf", "Western Ross Sea Deep",
 "East Antarctic Seas Shelf", "East Antarctic Seas Deep"]
Variables
The variables list has a python dictionary for each variable to be plotted.
A separate gallery will be produced for each variable with a title given by
the "title" entry in the dictionary. The "units" entry is used for the
y-axis label of each plot. The "name" is the name of the variable in
the NetCDF files as well as the text appended to subtaks names and file names.
It should contain no spaces. The "mpas" entry is the name of the
corresponding field in the MPAS-Ocean timeSeriesStatsMonthlyOutput files.
Other Options
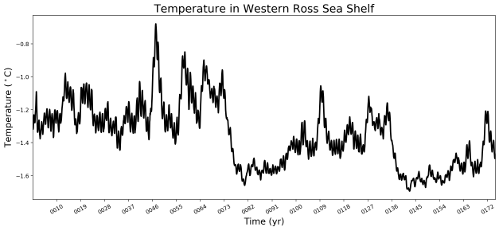
Example Result