climatologyMapBSF
An analysis task for comparison of maps of barotropic streamfunction (BSF).
Component and Tags:
component: ocean
tags: climatology, horizontalMap, barotropicStreamfunction, publicObs, streamfunction
Configuration Options
The following configuration options are available for this task:
[climatologyMapBSF]
## options related to plotting horizontally remapped climatologies of
## the barotropic streamfunction (BSF) against control model results
## (if available)

# colormap for model/observations
colormapNameResult = 3wave-blue-red-brown
# whether the colormap is indexed or continuous
colormapTypeResult = continuous
# color indices into colormapName for filled contours
# the type of norm used in the colormap
normTypeResult = linear
# A dictionary with keywords for the norm
normArgsResult = {'vmin': -100, 'vmax': 200.}
# Adding contour lines to the figure
contourLevelsResult = np.arange(-100., 201.0, 10.)
contourThicknessResult = 0.5
contourColorResult = black
# The spacing (in meters) between arrows on contours in projection plots
# (None to disable)
arrowSpacingResult = 8e5
# The width (in meters) of arrows on contours in projection plots (None to
# disable)
arrowWidthResult = 1.5e4

# colormap for differences
colormapNameDifference = cmo.balance
# whether the colormap is indexed or continuous
colormapTypeDifference = continuous
# the type of norm used in the colormap
normTypeDifference = linear
# A dictionary with keywords for the norm
normArgsDifference = {'vmin': -10., 'vmax': 10.}
# colorbarTicksDifference = numpy.linspace(-10., 10., 9)

# Months or seasons to plot (Jan, Feb, Mar, Apr, May, Jun, Jul, Aug, Sep, Oct,
# Nov, Dec, JFM, AMJ, JAS, OND, ANN)
seasons =  ['ANN']

# comparison grid(s) on which to plot analysis
comparisonGrids = ['latlon', 'subpolar_north_atlantic']

# list of tuples(pairs) of depths (min, max) to integrate horizontal transport
# over
depthRanges = [(10.0, -10000.0), (10.0, -2000.0)]

# minimum and maximum latitude (degrees) between which the mean BSF on boundary
# vertices averages to zero
latitudeRangeForZeroBSF = (-45.0, 90.0)
By default, the BSF is computed over two depth ranges—the full depth of
the ocean and only to 2000 m. By default, global and subpolar North Atlantic
plots are produced. The BSF is constrained to have a mean value on coastal
boundaries between the bounds set in latitudeRangeForZeroBSF.
You can set config options for individual comparison grids in a separate seciton with the suffix associated with the comparison grid appended, e.g.:
[climatologyMapBSF]
## options related to plotting horizontally remapped climatologies of
## the barotropic streamfunction (BSF) against control model results
## (if available)

# comparison grid(s) on which to plot analysis
comparisonGrids = ['latlon', 'arctic_extended', 'antarctic_extended',
                  'subpolar_north_atlantic', 'fris']

[climatologyMapBSFAntarcticExtended]
## options related to plotting Antarctic climatologies of the barotropic
## streamfunction (BSF)

# colormap for model/observations
colormapNameResult = blue-orange-div
# whether the colormap is indexed or continuous
colormapTypeResult = continuous
# color indices into colormapName for filled contours
# the type of norm used in the colormap
normTypeResult = symLog
# A dictionary with keywords for the norm
normArgsResult = {'linthresh': 30., 'linscale': 0.5, 'vmin': -150., 'vmax': 150.}
colorbarTicksResult = [-150., -100.,-60., -40., -20., -10., 0., 10., 20., 40., 60., 100., 150.]
# Adding contour lines to the figure
contourLevelsResult = np.arange(-150., 150.1, 10.)
contourThicknessResult = 0.5
contourColorResult = black
# The spacing (in meters) between arrows on contours in projection plots
# (None to disable)
arrowSpacingResult = 8e5
# The width (in meters) of arrows on contours in projection plots (None to
# disable)
arrowWidthResult = 1.5e4

# colormap for differences
colormapNameDifference = cmo.balance
# whether the colormap is indexed or continuous
colormapTypeDifference = continuous
# the type of norm used in the colormap
normTypeDifference = linear
# A dictionary with keywords for the norm
normArgsDifference = {'vmin': -10., 'vmax': 10.}
# colorbarTicksDifference = numpy.linspace(-10., 10., 9)

# minimum and maximum latitude (degrees) between which the mean BSF on boundary
# vertices averages to zero
latitudeRangeForZeroBSF = (-90.0, -60.0)
You must define both a new set of colormaps, norms, etc. and a new range of latitudes over which the BSF is constrained to have a mean value of zero.
This is useful because plots are more intuitive if the BSF is close to zero at local boundaries.
- For more details, see:
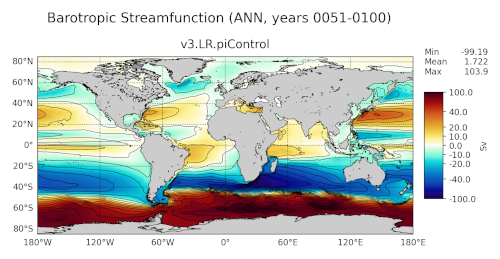
Example Result