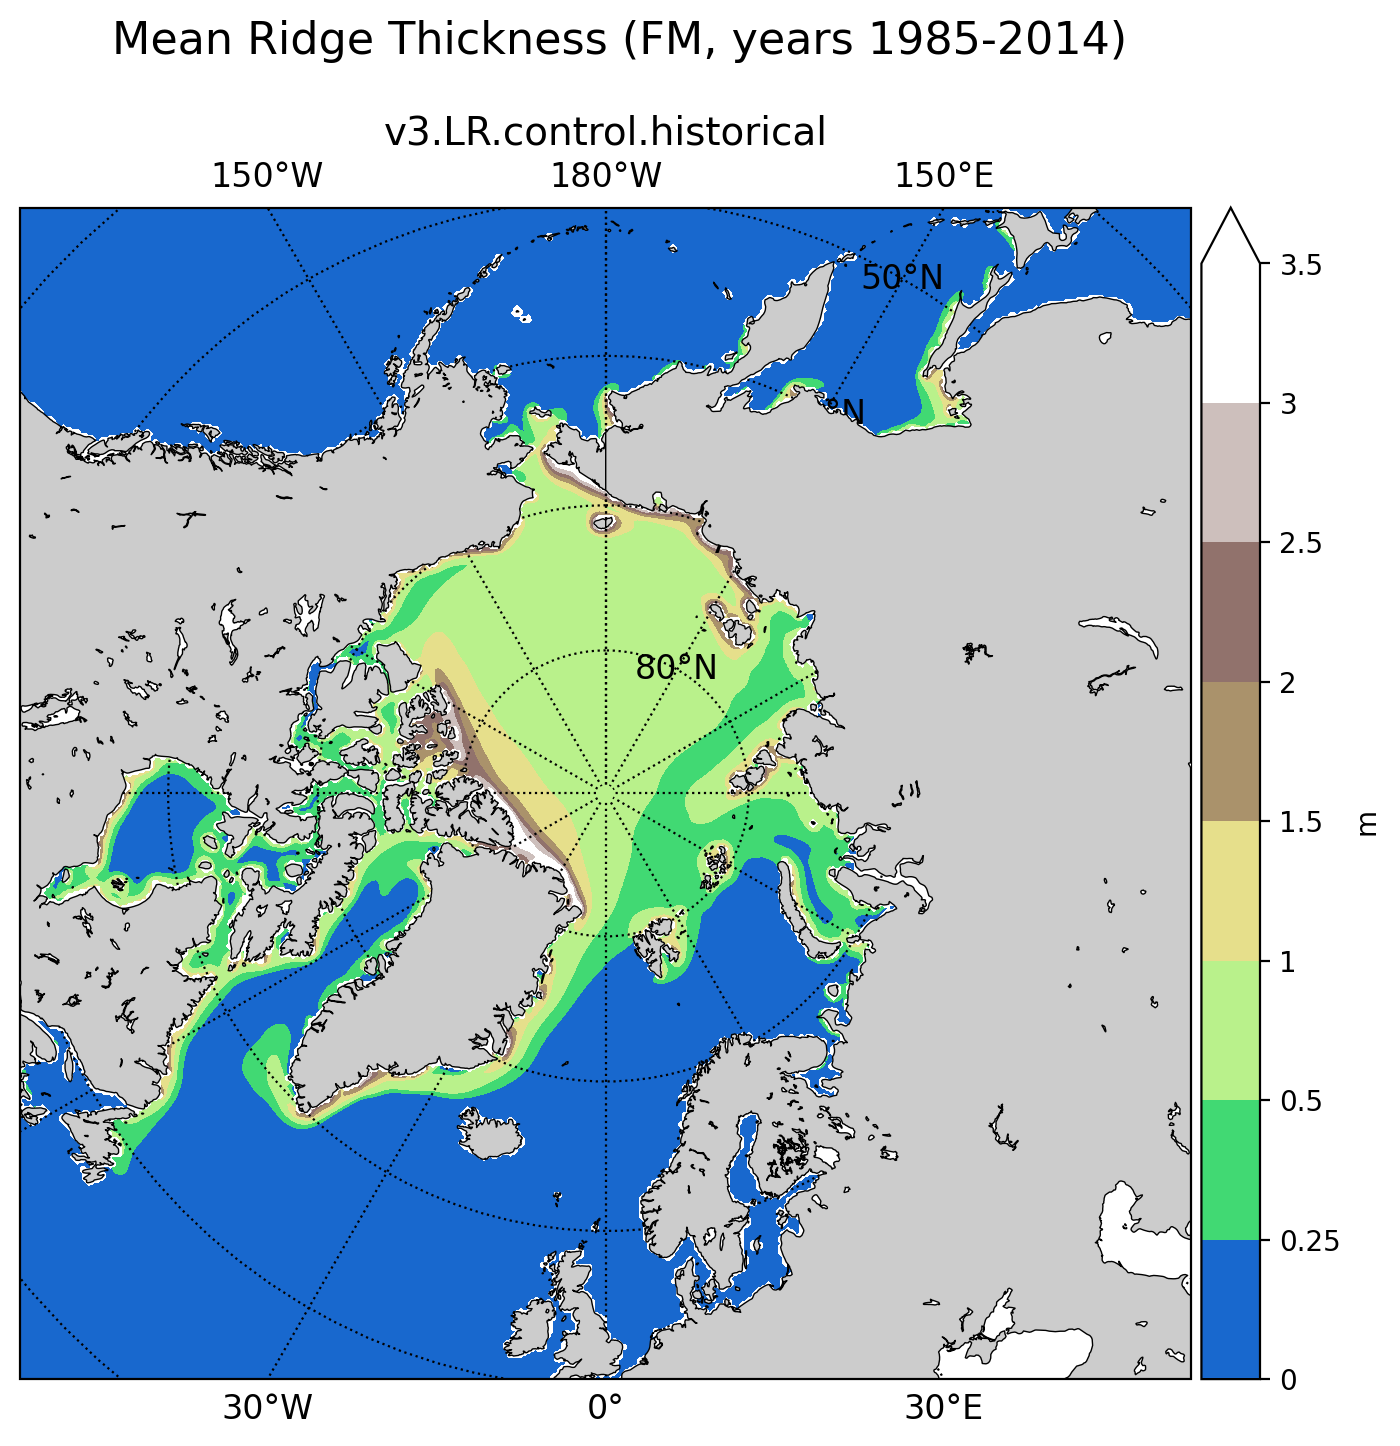
climatologyMapSeaIceVolumeRidgeNH
An analysis task for plotting maps of Arctic sea ice ridged volume per unit ice area.
Component and Tags:
component: seaIce
tags: climatology, horizontalMap, seaIceVolumeRidge, publicObs
Configuration Options
The following configuration options are available for this task:
[climatologyMapSeaIceVolumeRidgeNH]
## options related to plotting horizontally remapped climatologies of
## ridged volume of sea ice
## in the northern hemisphere (NH)

# colormap for model/observations
colormapNameResult = terrain
# whether the colormap is indexed or continuous
colormapTypeResult = indexed
# color indices into colormapName for filled contours
colormapIndicesResult = [20, 80, 110, 140, 170, 200, 230, 255]
# colormap levels/values for contour boundaries
colorbarLevelsResult = [0, 0.25, 0.5, 1, 1.5, 2, 2.5, 3, 3.5]

# colormap for differences
colormapNameDifference = balance
# whether the colormap is indexed or continuous
colormapTypeDifference = indexed
# color indices into colormapName for filled contours
colormapIndicesDifference = [0, 32, 64, 96, 112, 128, 128, 144, 160, 192, 224, 255]
# colormap levels/values for contour boundaries
colorbarLevelsDifference = [-3., -2.5, -2, -0.5, -0.1, 0, 0.1, 0.5, 2, 2.5, 3.]

# Times for comparison
seasons =  ['FM', 'ON']

# comparison grid(s) (typically 'arctic_extended') on which to plot analysis
comparisonGrids = ['arctic_extended']

# arrange subplots vertically?
vertical = False
The option vertical = True can be used to plot 3 panels one above another
(resulting in a tall, thin image) rather than next to each other, the default
(resulting in a short, wide image).
- For details on the remaining configration options, see:
Example Result