climatologyMapSeaIceAlbedoSH
An analysis task for plotting maps of Antrctic sea ice broadband albedo. Care must be taken when evaluating albedo - long-time averages do not make a lot of sense, especially when the sun is below the horizon for part of the averaging period and albedo is not well-defined.
Component and Tags:
component: seaIce
tags: climatology, horizontalMap, seaIceBroadbandAlbedo, publicObs, snow_on_sea_ice
Configuration Options
The following configuration options are available for this task:
[climatologyMapSeaIceAlbedoSH]
## options related to plotting horizontally remapped climatologies of
## sea ice broadband albedo against control model results and observations
## in the southern hemisphere (SH)

# colormap for model/observations
colormapNameResult = lapaz
# whether the colormap is indexed or continuous
colormapTypeResult = indexed
# color indices into colormapName for filled contours
colormapIndicesResult = [20, 80, 110, 140, 170, 200, 230, 255]
# colormap levels/values for contour boundaries
colorbarLevelsResult = [0.1, 0.3, 0.6, 0.7, 0.8, 0.9, 0.95, 0.98, 1.0]

# colormap for differences
colormapNameDifference = balance
# whether the colormap is indexed or continuous
colormapTypeDifference = indexed
# color indices into colormapName for filled contours
colormapIndicesDifference = [0, 32, 64, 96, 112, 128, 128, 144, 160, 192, 224, 255]
# colormap levels/values for contour boundaries
colorbarLevelsDifference = [-1., -0.8, -0.6, -0.4, -0.2, -0.1, 0, 0.1, 0.2, 0.4, 0.6, 0.8, 1.]

# Times for comparison
seasons =  ['FM', 'ON']

# comparison grid(s) (typically 'arctic_extended') on which to plot analysis
comparisonGrids = ['antarctic_extended']

# reference lat/lon for sea ice plots in the southern hemisphere
minimumLatitude = -50
referenceLongitude = 180

# arrange subplots vertically?
vertical = False
The option minimumLatitude determines what the northernmost latitude (in
degrees) included in the plot will be. The option referenceLongitude
defines which longitude will be at the bottom of the plot.
The option vertical = True can be used to plot 3 panels one above another
(resulting in a tall, thin image) rather than next to each other, the default
(resulting in a short, wide image).
- For details on the remaining configration options, see:
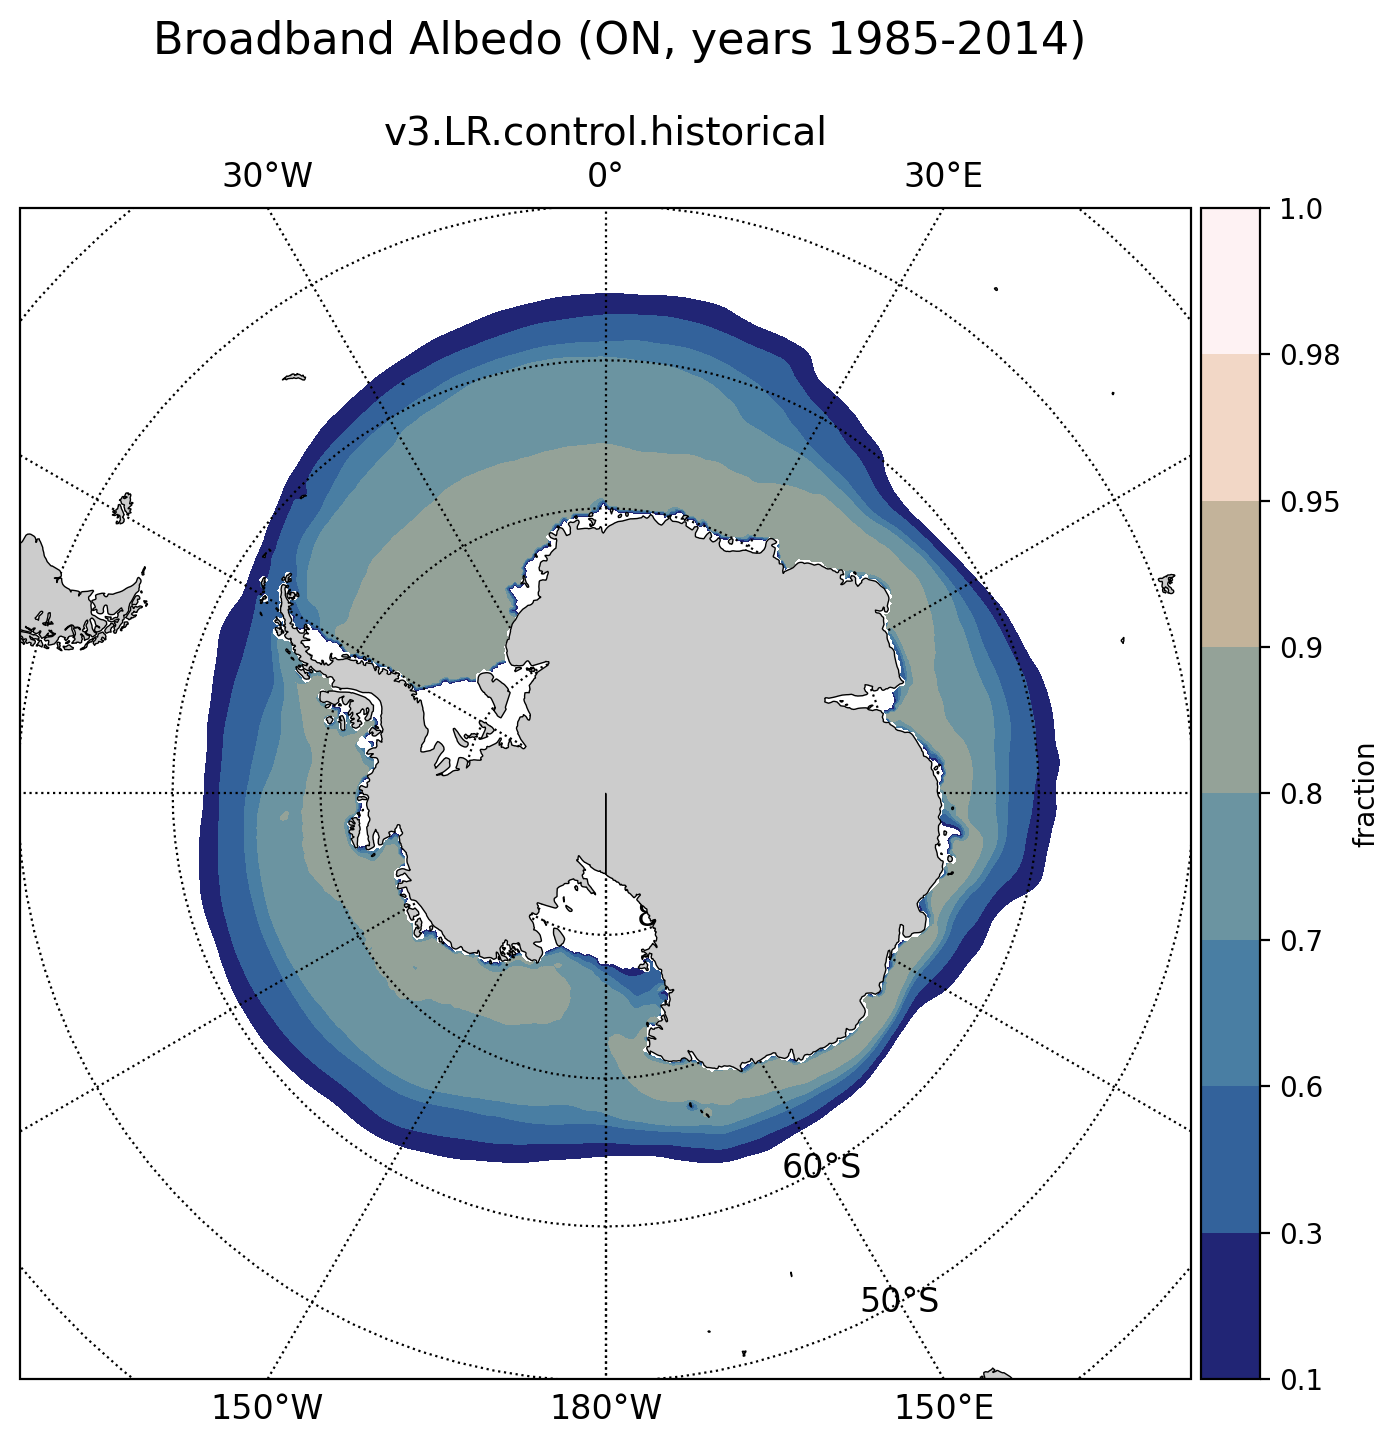
Example Result