timeSeriesOceanRegions
An analysis task for plotting time series of of temperature, salinity, potential density and other fields of interest averaged over ocean regions.
Component and Tags:
component: ocean
tags: timeSeries, regions
Configuration Options
The following configuration options are available for this task:
[timeSeriesOceanRegions]
## options related to plotting time series of groups of ocean regions

# the names of region groups to plot, each with its own section below
regionGroups = ['Ocean Basins', 'Arctic Ocean Regions', 'Antarctic Regions']

# a list of variables available to plot
availableVariables = [
    {'name': 'temperature',
    'title': 'Temperature',
    'units': r'$$^\circ$$C',
    'mpas': ['timeMonthly_avg_activeTracers_temperature']},
    {'name': 'salinity',
    'title': 'Salinity',
    'units': 'PSU',
    'mpas': ['timeMonthly_avg_activeTracers_salinity']},
    {'name': 'potentialDensity',
    'title': 'Potential Density',
    'units': 'kg m$$^{-3}$$',
    'mpas': ['timeMonthly_avg_potentialDensity']},
    {'name': 'thermalForcing',
    'title': 'Thermal Forcing',
    'units': r'$$^\circ$$C',
    'mpas': ['timeMonthly_avg_activeTracers_temperature',
              'timeMonthly_avg_activeTracers_salinity',
              'timeMonthly_avg_density']},
    {'name': 'oceanHeatContent',
    'title': 'Ocean Heat Content',
    'units': r'$$10^{22}$$ J',
    'mpas': ['timeMonthly_avg_activeTracers_temperature']},
    {'name': 'mixedLayerDepth',
    'title': 'Mixed Layer Depth',
    'units': 'm',
    'mpas': ['timeMonthly_avg_dThreshMLD']}]

# allow for longer plot titles
maxTitleLength = 70

[timeSeriesOceanBasins]
## options related to plotting time series of Ocean Basins

# list of regions to plot or ['all'] for all regions in the masks file.
# See "regionNames" in the oceanBasins masks file in
# regionMaskSubdirectory for details.
regionNames = ['all']

# a list of variables to plot from availableVariables in timeSeriesOceanRegions
variables = ['oceanHeatContent']

# variables that are anomalies
anomalies = ['oceanHeatContent']

# The minimum and maximum depth over which fields are averaged.
zmin = -10000
zmax = 0

# Observational data sets to compare against
obs = []

[timeSeriesArcticOceanRegions]
## options related to plotting time series of Arctic Ocean regions

# list of regions to plot or ['all'] for all regions in the masks file.
# See "regionNames" in the arcticOceanRegions masks file in
# regionMaskSubdirectory for details.
regionNames = []

# a list of variables to plot from availableVariables in timeSeriesOceanRegions
variables = ['temperature', 'salinity', 'potentialDensity', 'mixedLayerDepth']

# variables that are anomalies
anomalies = []

# The minimum and maximum depth over which fields are averaged.
zmin = -1000
zmax = 0

# Observational data sets to compare against
obs = ['WOA18']


[timeSeriesAntarcticRegions]
## options related to plotting time series of Antarctic regions

# list of regions to plot or ['all'] for all regions in the masks file.
# See "regionNames" in the antarcticRegions masks file in
# regionMaskSubdirectory for details.
regionNames = []

# a list of variables to plot from availableVariables in timeSeriesOceanRegions
variables = ['temperature', 'salinity', 'potentialDensity', 'thermalForcing',
            'oceanHeatContent', 'mixedLayerDepth']

# variables that are anomalies
anomalies = ['oceanHeatContent']

# The minimum and maximum depth over which fields are averaged, default is
# to take these values from the geojson feature's zmin and zmax properties.
# Add these to a custom config file to override the defaults.
# zmin = -1000
# zmax = -400

# Observational data sets to compare against
obs = ['SOSE', 'WOA23']
Region Groups
regionGroup is a list of region groups, each of which will get its own
gallery group on the resulting analysis webpage. See
Region Groups for more information on the available region
groups. For each region group, there should be a corresponding
timeSeries<RegionGroup> section of the config file, with any spaces removed
from the name of the region group. By default, the only region group for this
task is 'Antarctic Regions'.
Available Variables
The availableVariables list has a python dictionary for each variable that
is available to be plotted. A separate gallery will be produced for each
requested variable with a title given by the "title" entry in the
dictionary. The "units" entry is used for the y-axis label of each plot.
The "name" is the name of the variable in the NetCDF files as well as the
text appended to subtaks names and file names. It should contain no spaces.
The "mpas" entry is the name of the corresponding field in the MPAS-Ocean
timeSeriesStatsMonthlyOutput files.
Region Names
The regionNames can be set to ['all'] to plot all of the regions in the
region group. In the case of Antarctic Regions, these are:
["Southern Ocean", "Southern Ocean 60S", "Eastern Weddell Sea Shelf",
 "Eastern Weddell Sea Deep", "Western Weddell Sea Shelf",
 "Western Weddell Sea Deep", "Weddell Sea Shelf", "Weddell Sea Deep",
 "Bellingshausen Sea Shelf", "Bellingshausen Sea Deep", "Amundsen Sea Shelf",
 "Amundsen Sea Deep", "Eastern Ross Sea Shelf", "Eastern Ross Sea Deep",
 "Western Ross Sea Shelf", "Western Ross Sea Deep",
 "East Antarctic Seas Shelf", "East Antarctic Seas Deep"]
Variables
The variables list are the variables from availableVariables that
should be plotted in a given region.
Anomalies
The anomalies list are the variables from variables that should be
plotted as anomalies from the beginning of the simulation or from
anomalyRefYear for time series if that config option is defined.
By default, this is applied to the ocean heat content in cases where it is
being plotted.
Depth Bounds
Some region groups such as Antarctic Regions define default depth bounds
(zmin and zmax) for each region. For Antarctic Regions, this was
done so regions on the continental shelf (ending in “Shelf”) would be averaged
over a different range (zmax = -200 m, zmin = -1000 m) than the regions
of the deeper ocean (ending in “Deep”, with zmax = -400 m,
zmin = -1000 m). The user can override these defaults by defining her own
zmin and zmax. Note that zmin is deeper and zmax is shallower
since they have negative values.
Other Config Options
maxTitleLength is used to give titles of these plots more space than
allowed in typical plots.
- For more details, see:
Observations
obs is a list of the observational data sets to plot as reference lines
(constant in time). Possible values are 'SOSE' and 'WOA23'. An empty
list can be provided if no observations should be plotted.
2005-2010 climatology from SOSE the Southern Ocean State Estimate (SOSE)
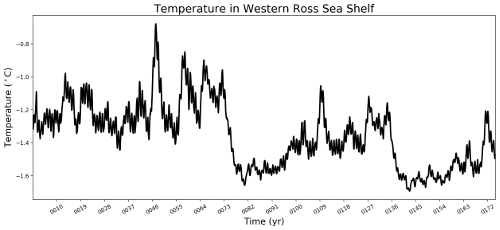
Example Result