geojsonNetcdfTransects
An analysis task for interpolating MPAS fields to transects specified by files in geojson or NetDF format.
Component and Tags:
component: ocean
tags: climatology, transect, geojson, netcdf
Configuration Options
The following configuration options are available for this task:
[geojsonNetcdfTransects]
## options related to plotting model transects at points determined by a
## user-specified geojson or NetCDF file.
##
## To generate your own geojson file, go to:
##   http://geojson.io/
## and draw one or more polylines, then add a name to each:
##
##      "properties": {
##        "name": "My Favorite Name"
##      },
## and save the file as GeoJSON (say transects.geojson).  Finally, set the
## option:
##      geojsonFiles = ['transects.geojson']
## (giving an absolute path if necessary) in your custom config file.
##
## If you provide a NetCDF file instead, it simply needs to have 'lat` and
## `lon` variables.  The `lat` and `lon` variables should be 1D arrays
## with the same dimension name (e.g. 'nPoints').  The name of the file
## (without the base path or extension) will serve as the transect name with
## underscores converted to spaces.

# a list of geojson and/or NetCDF files.  The geojson files must contain
# lat/lon points in LineStrings to be plotted.  The NetCDF files need 'lat'
# and 'lon' variables with the same dimesion name.  If relative paths are
# given, they are relative to the current working directory.  The files must
# be listed in quotes, e.g.:
#     geojsonOrNetcdfFiles = ['file1.geojson', '/path/to/file2.geojson', 'file3.nc']
geojsonOrNetcdfFiles = []

# a list of dictionaries for each field to plot.  The dictionary includes
# prefix (used for file names, task names and sections) as well as the mpas
# name of the field, units for colorbars and a the name as it should appear
# in figure titles and captions.
fields =
    [{'prefix': 'temperature',
      'mpas': 'timeMonthly_avg_activeTracers_temperature',
      'units': r'$$\degree$$C',
      'titleName': 'Potential Temperature'},
    {'prefix': 'salinity',
      'mpas': 'timeMonthly_avg_activeTracers_salinity',
      'units': r'PSU',
      'titleName': 'Salinity'},
    {'prefix': 'potentialDensity',
      'mpas': 'timeMonthly_avg_potentialDensity',
      'units': r'kg m$$^{-3}$$',
      'titleName': 'Potential Density'},
    {'prefix': 'zonalVelocity',
      'mpas': 'timeMonthly_avg_velocityZonal',
      'units': r'm s$$^{-1}$$',
      'titleName': 'Zonal Velocity'},
    {'prefix': 'meridionalVelocity',
      'mpas': 'timeMonthly_avg_velocityMeridional',
      'units': r'm s$$^{-1}$$',
      'titleName': 'Meridional Velocity'},
    {'prefix': 'vertVelocity',
      'mpas': 'timeMonthly_avg_vertVelocityTop',
      'units': r'm s$$^{-1}$$',
      'titleName': 'Vertical Velocity'},
    {'prefix': 'vertDiff',
      'mpas': 'timeMonthly_avg_vertDiffTopOfCell',
      'units': r'm s$$^{-1}$$',
      'titleName': 'Vertical Diffusivity'},
    {'prefix': 'vertVisc',
      'mpas': 'timeMonthly_avg_vertViscTopOfCell',
      'units': r'm s$$^{-1}$$',
      'titleName': 'Vertical Viscosity'},
    ]

# Times for comparison times (Jan, Feb, Mar, Apr, May, Jun, Jul, Aug, Sep, Oct,
# Nov, Dec, JFM, AMJ, JAS, OND, ANN)
seasons =  ['ANN']

# The approximate horizontal resolution (in km) of each transect.  Latitude/
# longitude between observation points will be subsampled at this interval.
# Use 'obs' to indicate no subsampling. Use 'mpas' to indicate plotting of
# model data on the native grid.
#horizontalResolution = mpas
#horizontalResolution = obs
horizontalResolution = 5

# The name of the vertical comparison grid.  Valid values are 'mpas' for the
# MPAS vertical grid or any other name if the vertical grid is defined by
# 'verticalComparisonGrid'
#verticalComparisonGridName = mpas
verticalComparisonGridName = uniform_0_to_4000m_at_10m

# The vertical comparison grid if 'verticalComparisonGridName' is not 'mpas'.
# This should be numpy array of (typically negative) elevations (in m).
# The first and last entries are used as axis bounds for 'mpas' vertical
# comparison grids
verticalComparisonGrid = numpy.linspace(0, -4000, 401)

# A range for the y axis (if any)
verticalBounds = []

# The minimum weight of a destination cell after remapping. Any cell with
# weights lower than this threshold will therefore be masked out.
renormalizationThreshold = 0.01


[geojsonNetcdfTemperatureTransects]
## options related to plotting geojson transects of potential temperature

# colormap for model/observations
colormapNameResult = RdYlBu_r
# whether the colormap is indexed or continuous
colormapTypeResult = continuous
# the type of norm used in the colormap
normTypeResult = linear
# A dictionary with keywords for the norm
normArgsResult = {'vmin': -2., 'vmax': 30.}
# place the ticks automatically by default
# colorbarTicksResult = numpy.linspace(-2., 2., 9)
# contour line levels (use [] for automatic contour selection, 'none' for no
# contour lines)
contourLevelsResult = []

# colormap for differences
colormapNameDifference = balance
# whether the colormap is indexed or continuous
colormapTypeDifference = continuous
# the type of norm used in the colormap
normTypeDifference = linear
# A dictionary with keywords for the norm
normArgsDifference = {'vmin': -2., 'vmax': 2.}
# place the ticks automatically by default
# colorbarTicksDifference = numpy.linspace(-2., 2., 9)
# contour line levels (use [] for automatic contour selection, 'none' for no
# contour lines)
contourLevelsDifference = []


[geojsonNetcdfSalinityTransects]
## options related to plotting geojson transects of salinity

# colormap for model/observations
colormapNameResult = haline
# whether the colormap is indexed or continuous
colormapTypeResult = continuous
# the type of norm used in the colormap
normTypeResult = linear
# A dictionary with keywords for the norm
normArgsResult = {'vmin': 30, 'vmax': 39.0}
# place the ticks automatically by default
# colorbarTicksResult = numpy.linspace(34.2, 35.2, 9)
# contour line levels (use [] for automatic contour selection, 'none' for no
# contour lines)
contourLevelsResult = []

# colormap for differences
colormapNameDifference = balance
# whether the colormap is indexed or continuous
colormapTypeDifference = continuous
# the type of norm used in the colormap
normTypeDifference = linear
# A dictionary with keywords for the norm
normArgsDifference = {'vmin': -0.5, 'vmax': 0.5}
# place the ticks automatically by default
# colorbarTicksDifference = numpy.linspace(-0.5, 0.5, 9)
# contour line levels (use [] for automatic contour selection, 'none' for no
# contour lines)
contourLevelsDifference = []


[geojsonNetcdfPotentialDensityTransects]
## options related to plotting geojson transects of potential density

# colormap for model/observations
colormapNameResult = Spectral_r
# whether the colormap is indexed or continuous
colormapTypeResult = continuous
# the type of norm used in the colormap
normTypeResult = linear
# A dictionary with keywords for the norm
normArgsResult = {'vmin': 1026.5, 'vmax': 1028.}
# place the ticks automatically by default
# colorbarTicksResult = numpy.linspace(1026., 1028., 9)
# contour line levels (use [] for automatic contour selection, 'none' for no
# contour lines)
contourLevelsResult = []

# colormap for differences
colormapNameDifference = balance
# whether the colormap is indexed or continuous
colormapTypeDifference = continuous
# the type of norm used in the colormap
normTypeDifference = linear
# A dictionary with keywords for the norm
normArgsDifference = {'vmin': -0.3, 'vmax': 0.3}
# place the ticks automatically by default
# colorbarTicksDifference = numpy.linspace(-0.3, 0.3, 9)
# contour line levels (use [] for automatic contour selection, 'none' for no
# contour lines)
contourLevelsDifference = []


[geojsonNetcdfZonalVelocityTransects]
## options related to plotting geojson transects of zonal velocity

# colormap for model/observations
colormapNameResult = delta
# whether the colormap is indexed or continuous
colormapTypeResult = continuous
# the type of norm used in the colormap
normTypeResult = linear
# A dictionary with keywords for the norm
normArgsResult = {'vmin': -0.05, 'vmax': 0.05}
# determine the ticks automatically by default, uncomment to specify
# colorbarTicksResult = numpy.linspace(-0.2, 0.2, 9)
# contour line levels (use [] for automatic contour selection, 'none' for no
# contour lines)
contourLevelsResult = 'none'

# colormap for differences
colormapNameDifference = balance
# whether the colormap is indexed or continuous
colormapTypeDifference = continuous
# the type of norm used in the colormap
normTypeDifference = linear
# A dictionary with keywords for the norm
normArgsDifference = {'vmin': -0.05, 'vmax': 0.05}
# determine the ticks automatically by default, uncomment to specify
# colorbarTicksDifference = numpy.linspace(-0.2, 0.2, 9)
# contour line levels (use [] for automatic contour selection, 'none' for no
# contour lines)
contourLevelsDifference = 'none'


[geojsonNetcdfMeridionalVelocityTransects]
## options related to plotting geojson transects of meridional velocity

# colormap for model/observations
colormapNameResult = delta
# whether the colormap is indexed or continuous
colormapTypeResult = continuous
# the type of norm used in the colormap
normTypeResult = linear
# A dictionary with keywords for the norm
normArgsResult = {'vmin': -0.05, 'vmax': 0.05}
# determine the ticks automatically by default, uncomment to specify
# colorbarTicksResult = numpy.linspace(-0.2, 0.2, 9)
# contour line levels (use [] for automatic contour selection, 'none' for no
# contour lines)
contourLevelsResult = 'none'

# colormap for differences
colormapNameDifference = balance
# whether the colormap is indexed or continuous
colormapTypeDifference = continuous
# the type of norm used in the colormap
normTypeDifference = linear
# A dictionary with keywords for the norm
normArgsDifference = {'vmin': -0.05, 'vmax': 0.05}
# determine the ticks automatically by default, uncomment to specify
# colorbarTicksDifference = numpy.linspace(-0.2, 0.2, 9)
# contour line levels (use [] for automatic contour selection, 'none' for no
# contour lines)
contourLevelsDifference = 'none'

[geojsonNetcdfVertVelocityTransects]
## options related to plotting geojson transects of meridional velocity

# colormap for model/observations
colormapNameResult = delta
# whether the colormap is indexed or continuous
colormapTypeResult = continuous
# the type of norm used in the colormap
normTypeResult = linear
# A dictionary with keywords for the norm
normArgsResult = {'vmin': -1e-5, 'vmax': 1e-5}
# determine the ticks automatically by default, uncomment to specify
# colorbarTicksResult = numpy.linspace(-0.2, 0.2, 9)
# contour line levels (use [] for automatic contour selection, 'none' for no
# contour lines)
contourLevelsResult = 'none'

# colormap for differences
colormapNameDifference = balance
# whether the colormap is indexed or continuous
colormapTypeDifference = continuous
# the type of norm used in the colormap
normTypeDifference = linear
# A dictionary with keywords for the norm
normArgsDifference = {'vmin': -1e-5, 'vmax': 1e-5}
# determine the ticks automatically by default, uncomment to specify
# colorbarTicksDifference = numpy.linspace(-0.2, 0.2, 9)
# contour line levels (use [] for automatic contour selection, 'none' for no
# contour lines)
contourLevelsDifference = 'none'

[geojsonNetcdfVertDiffTransects]
## options related to plotting geojson transects of meridional velocity

# colormap for model/observations
colormapNameResult = diff
# whether the colormap is indexed or continuous
colormapTypeResult = continuous
# the type of norm used in the colormap
normTypeResult = linear
# A dictionary with keywords for the norm
normArgsResult = {'vmin': -0.5, 'vmax': 0.5}
# determine the ticks automatically by default, uncomment to specify
# colorbarTicksResult = numpy.linspace(-0.2, 0.2, 9)
# contour line levels (use [] for automatic contour selection, 'none' for no
# contour lines)
contourLevelsResult = 'none'

# colormap for differences
colormapNameDifference = balance
# whether the colormap is indexed or continuous
colormapTypeDifference = continuous
# the type of norm used in the colormap
normTypeDifference = linear
# A dictionary with keywords for the norm
normArgsDifference = {'vmin': -0.5, 'vmax': 0.5}
# determine the ticks automatically by default, uncomment to specify
# colorbarTicksDifference = numpy.linspace(-0.2, 0.2, 9)
# contour line levels (use [] for automatic contour selection, 'none' for no
# contour lines)
contourLevelsDifference = 'none'

[geojsonNetcdfVertViscTransects]
## options related to plotting geojson transects of meridional velocity

# colormap for model/observations
colormapNameResult = diff
# whether the colormap is indexed or continuous
colormapTypeResult = continuous
# the type of norm used in the colormap
normTypeResult = linear
# A dictionary with keywords for the norm
normArgsResult = {'vmin': -1., 'vmax': 1.}
# determine the ticks automatically by default, uncomment to specify
# colorbarTicksResult = numpy.linspace(-0.2, 0.2, 9)
# contour line levels (use [] for automatic contour selection, 'none' for no
# contour lines)
contourLevelsResult = 'none'

# colormap for differences
colormapNameDifference = balance
# whether the colormap is indexed or continuous
colormapTypeDifference = continuous
# the type of norm used in the colormap
normTypeDifference = linear
# A dictionary with keywords for the norm
normArgsDifference = {'vmin': -1., 'vmax': 1.}
# determine the ticks automatically by default, uncomment to specify
# colorbarTicksDifference = numpy.linspace(-0.2, 0.2, 9)
# contour line levels (use [] for automatic contour selection, 'none' for no
# contour lines)
contourLevelsDifference = 'none'
Geojson Files
This task takes a list of geojson or NetCDF file names (supplied as a python
list of str):
geojsonOrNetcdfFiles = ['file1.geojson', '/path/to/file2.geojson']
Geojson transects are specified by LineString objects in the files. Some
examples are provided in the MPAS geometric features repository. You can
also generate your own very easily at To generate your own geojson file, go to
geojson.io and draw one or more polylines, then add a name to each:
...
"properties": {
  "name": "My Favorite Name"
},
...
and save the file as GeoJSON (say transects.geojson). Finally, set the option:
geojsonFiles = ['transects.geojson']
(giving an absolute path if necessary) in your custom config file.
NetCDF Files
As an alternative to (or in addition to) geojson files, you may supply files in
NetCDF format. As before, you provide a list of file names as a python
list of str:
geojsonOrNetcdfFiles = ['file1.nc', '/path/to/file2.nc']
In this case, the stem of the filename (file1 and file2 in the example)
also serves as the name of the transect. The NetCDF files must contain
lat and lon variables. These variables should be 1D arrays with the
same dimension name (e.g. nPoints).
Fields
Since there are no observations associated with geojson transects, you are
free to choose which MPAS fields you would like to plot. These fields are
provided as a python dictionary. The keys are names for the fields (anything
you would like use as a prefix on files and subtask names, best if it does
not contain spaces). The values are python dictionaries. The values
associate with the mpas key are the names of the 3D fields where transects
are desired. The units entry indicates the units to display on the
colorbar. The titleName entry specifies the name of the field to include
in plot titles and captions.
Each field must have a corresponding section in the config file defining its
color maps. For example, temperature has an associated
[geojsonNetcdfTemperatureTransect] section.
Other Options
- For details on the remaining configuration options, see:
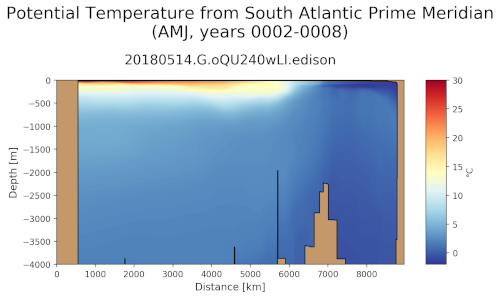
Example Result