climatologyMapWindStressCurl
An analysis task for plotting maps of wind stress curl.
Component and Tags:
component: ocean
tags: climatology, horizontalMap, windStressCurl, publicObs
Configuration Options
The following configuration options are available for this task:
[climatologyMapWindStressCurl]
## options related to plotting horizontally remapped climatologies of
## wind stress curl against control model results

# colormap for model/observations
colormapNameResult = cmo.curl
# whether the colormap is indexed or continuous
colormapTypeResult = continuous
# color indices into colormapName for filled contours
# the type of norm used in the colormap
normTypeResult = linear
# A dictionary with keywords for the norm
normArgsResult = {'vmin': -1e-6, 'vmax': 1e-6}

# colormap for differences
colormapNameDifference = cmo.balance
# whether the colormap is indexed or continuous
colormapTypeDifference = continuous
# the type of norm used in the colormap
normTypeDifference = linear
# A dictionary with keywords for the norm
normArgsDifference = {'vmin': -2e-7, 'vmax': 2e-7}

# Months or seasons to plot (Jan, Feb, Mar, Apr, May, Jun, Jul, Aug, Sep, Oct,
# Nov, Dec, JFM, AMJ, JAS, OND, ANN)
seasons =  ['ANN']

# comparison grid(s) on which to plot analysis
comparisonGrids = ['latlon']
For analysis focused on polar regions (using the --polar_regions flag),
the following config options add Arctic and Antarctic comparison grids:
[climatologyMapWindStressCurl]
## options related to plotting horizontally remapped climatologies of
## wind stress curl against control model results

# comparison grid(s) on which to plot analysis
comparisonGrids = ['latlon', 'arctic_extended', 'antarctic_extended']
- For more details, see:
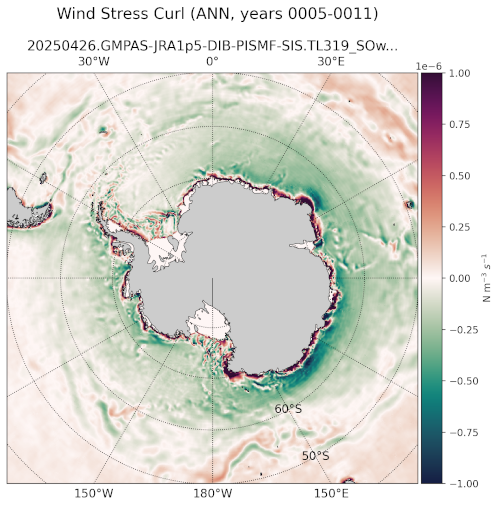
Example Result