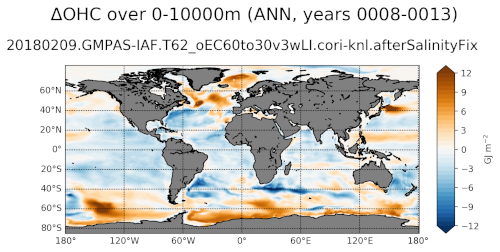
climatologyMapOHCAnomaly
An analysis task for plotting anomalies in ocean heat content (OHC) compared with a reference year (typically the start of the simulation).
Component and Tags:
component: ocean
tags: climatology, horizontalMap, deltaOHC, publicObs
Configuration Options
The following configuration options are available for this task:
[climatologyMapOHCAnomaly]
## options related to plotting horizontally remapped climatologies of
## ocean heat content (OHC) against reference model results (if available)

# colormap for model/observations
colormapNameResult = BuOr
# color indices into colormapName for filled contours
colormapIndicesResult = numpy.array(numpy.linspace(0, 255, 38), int)
# colormap levels/values for contour boundaries
colorbarLevelsResult = numpy.linspace(-12., 12., 37)
# colormap levels/values for ticks (defaults to same as levels)
colorbarTicksResult = numpy.linspace(-12., 12., 9)

# colormap for differences
colormapNameDifference = balance
# color indices into colormapName for filled contours
colormapIndicesDifference = numpy.array(numpy.linspace(0, 255, 10), int)
# colormap levels/values for contour boundaries
colorbarLevelsDifference = numpy.linspace(-2., 2., 11)

# Months or seasons to plot (Jan, Feb, Mar, Apr, May, Jun, Jul, Aug, Sep,
# Oct, Nov, Dec, JFM, AMJ, JAS, OND, ANN)
seasons =  ['ANN']

# comparison grid(s) ('latlon', 'antarctic') on which to plot analysis
comparisonGrids = ['latlon']

# A list of pairs of minimum and maximum depths (positive up, in meters) to
# include in the vertical sums.  The default values are the equivalents of the
# default ranges of the timeSeriesOHCAnomaly task, with a value of -10,000 m
# intended to be well below the bottom of the ocean for all existing MPAS-O
# meshes.
depthRanges = [(0.0, -10000.0), (0.0, -700.0), (-700.0, -2000.0),
               (-2000.0, -10000.0)]
- For more details, see:
The option depthRange is a list of upper and lower bounds in meters over
which to integrate the heat content.
Example Result