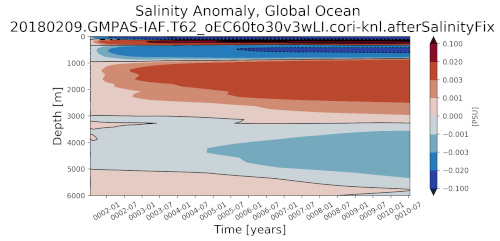
timeSeriesSalinityAnomaly
An analysis task for plotting a Hovmoller plot (time and depth axes) of the anomaly in ocean salinity from a reference year (usully the first year of the simulation).
Component and Tags:
component: ocean
tags: timeSeries, salinity, publicObs
Configuration Options
The following configuration options are available for this task:
[hovmollerSalinityAnomaly]
## options related to plotting time series of salinity vs. depth

# list of regions to plot from the region list in [regions] below
regions = ['global']

# Number of points over which to compute moving average(e.g., for monthly
# output, movingAveragePoints=12 corresponds to a 12-month moving average
# window)
movingAveragePoints = 12

# colormap
colormapName = balance
# color indices into colormapName for filled contours
colormapIndices = [0, 28, 57, 85, 113, 142, 170, 198, 227, 255]
# colormap levels/values for contour boundaries
colorbarLevels = [-0.1, -0.02, -0.003, -0.001, 0, 0.001, 0.003, 0.02, 0.1]
# contour line levels
contourLevels = np.arange(-0.1, 0.11, 0.02)

# An optional first year for the tick marks on the x axis. Leave commented out
# to start at the beginning of the time series.

# firstYearXTicks = 1

# An optional number of years between tick marks on the x axis.  Leave
# commented out to determine the distance between ticks automatically.

# yearStrideXTicks = 1
- For more details, see:
Example Result