climatologyMapWaves
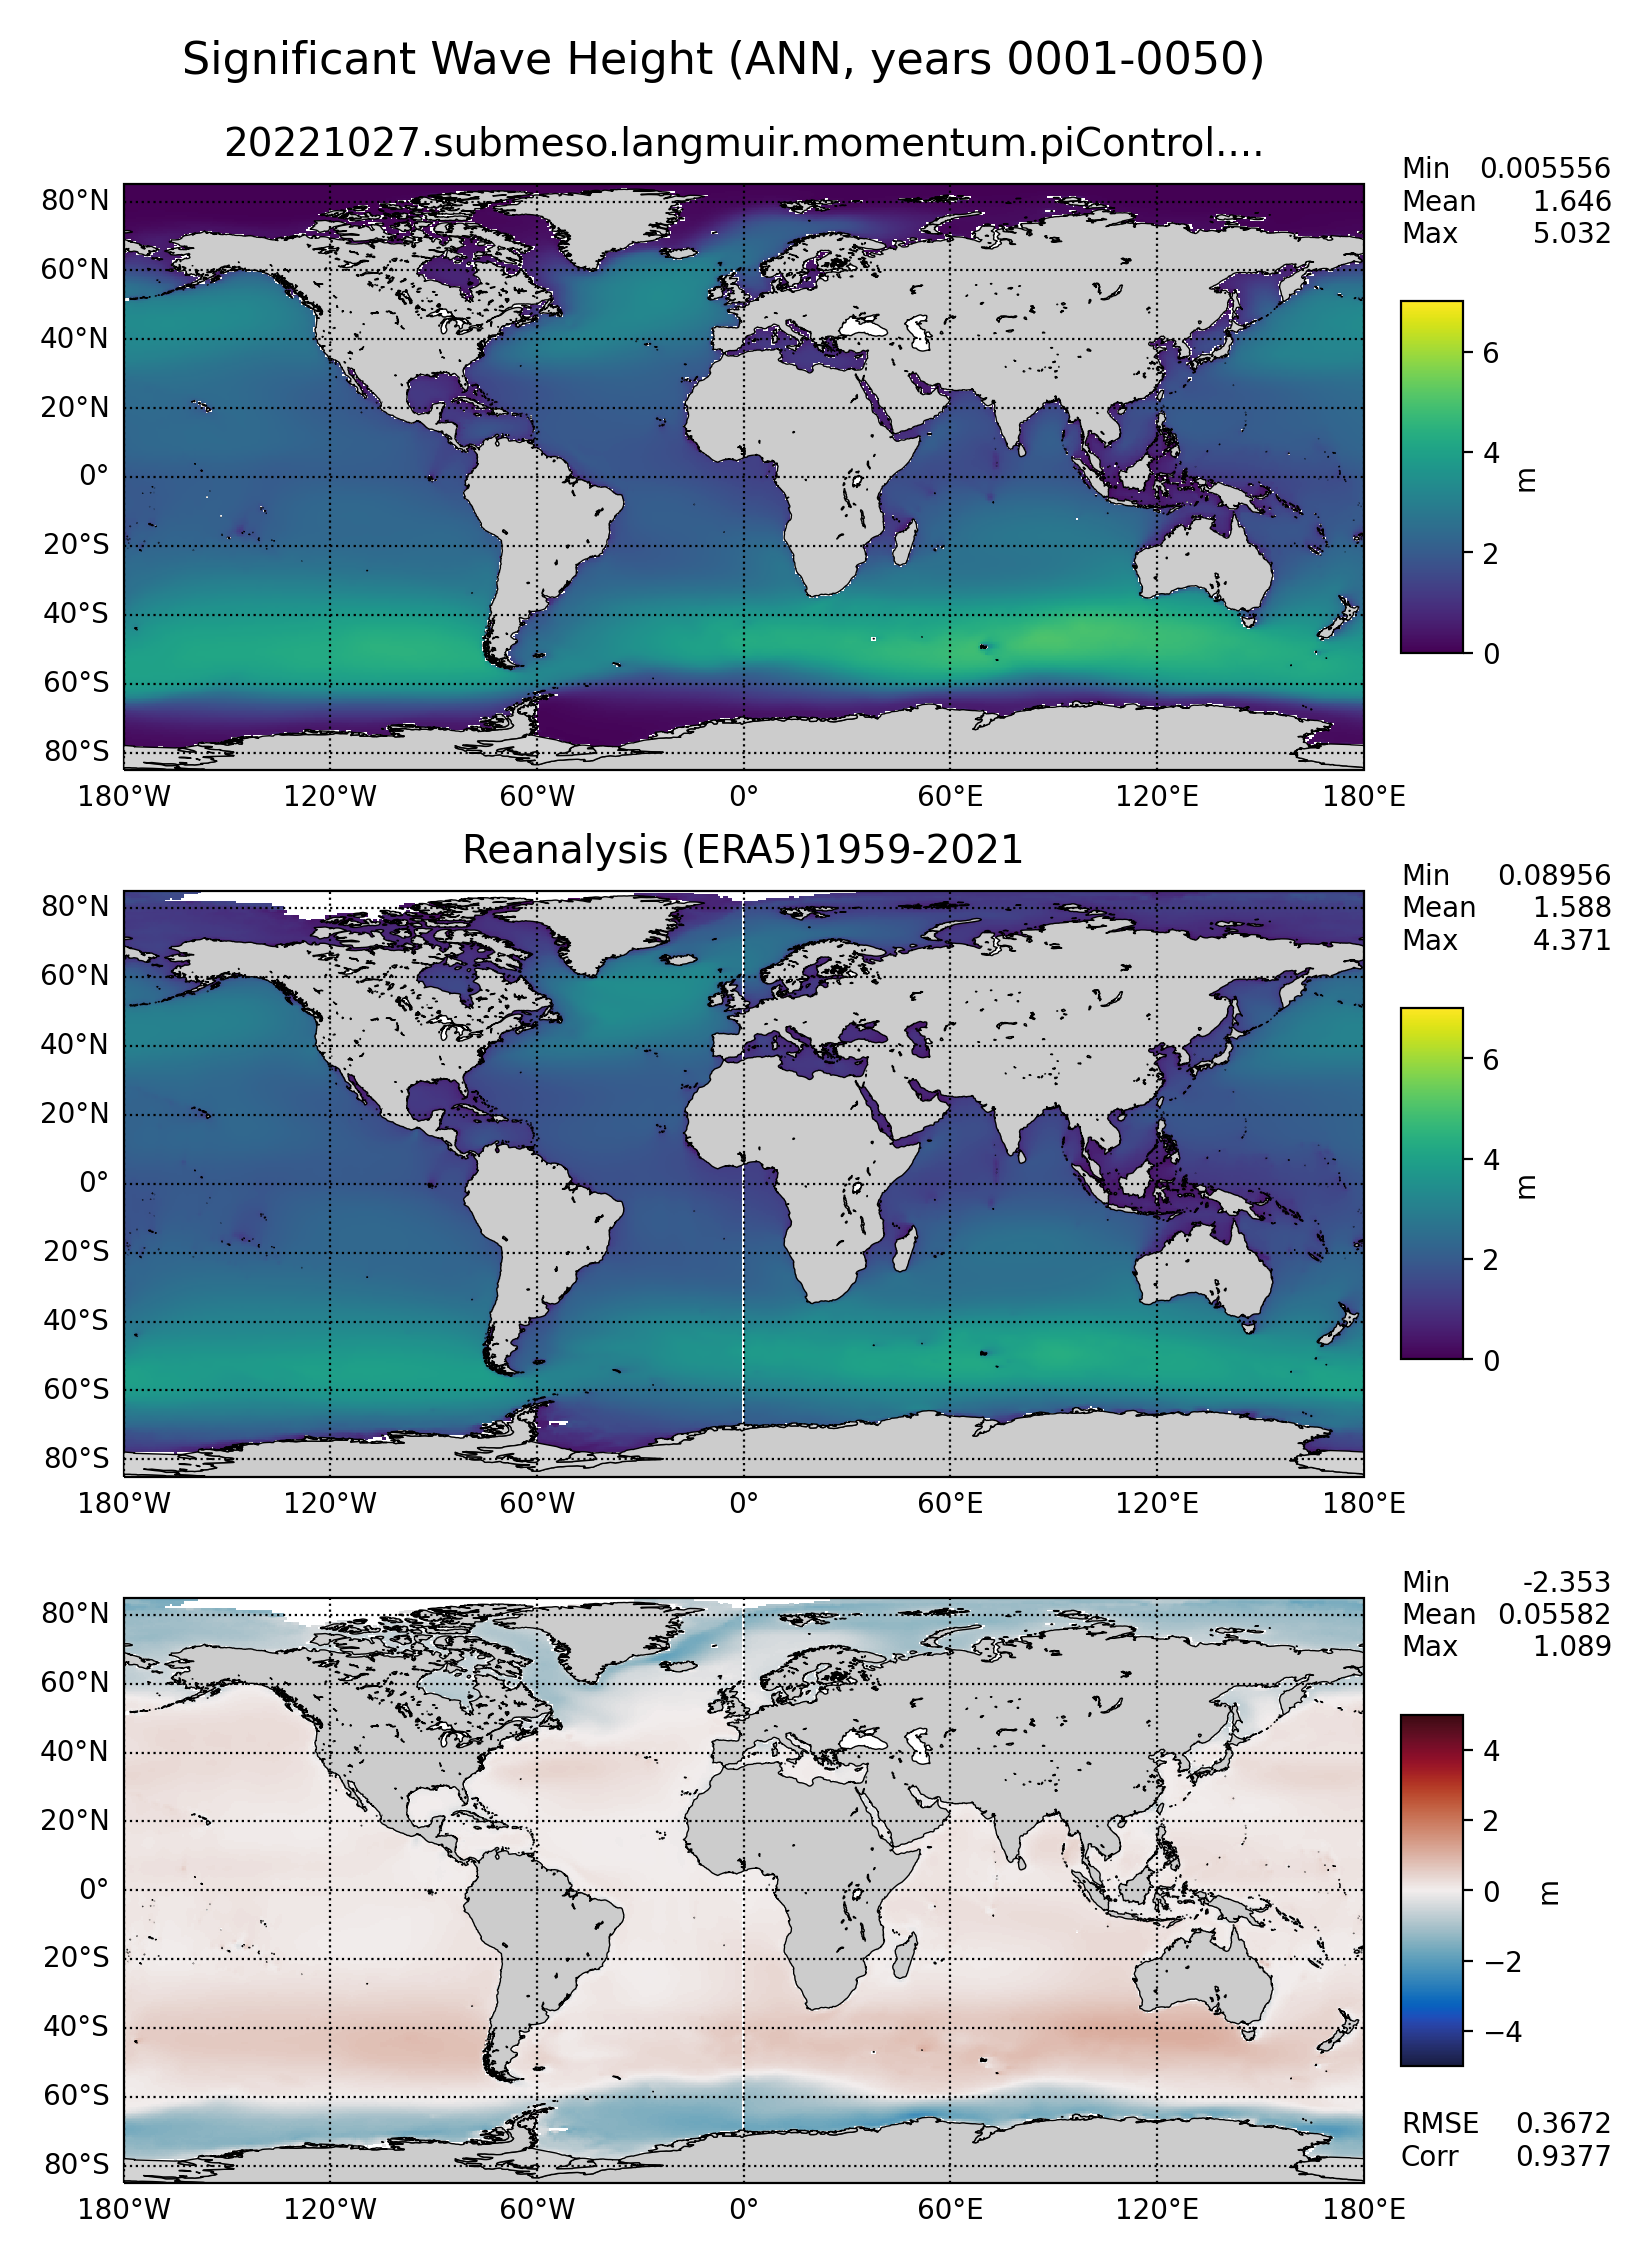
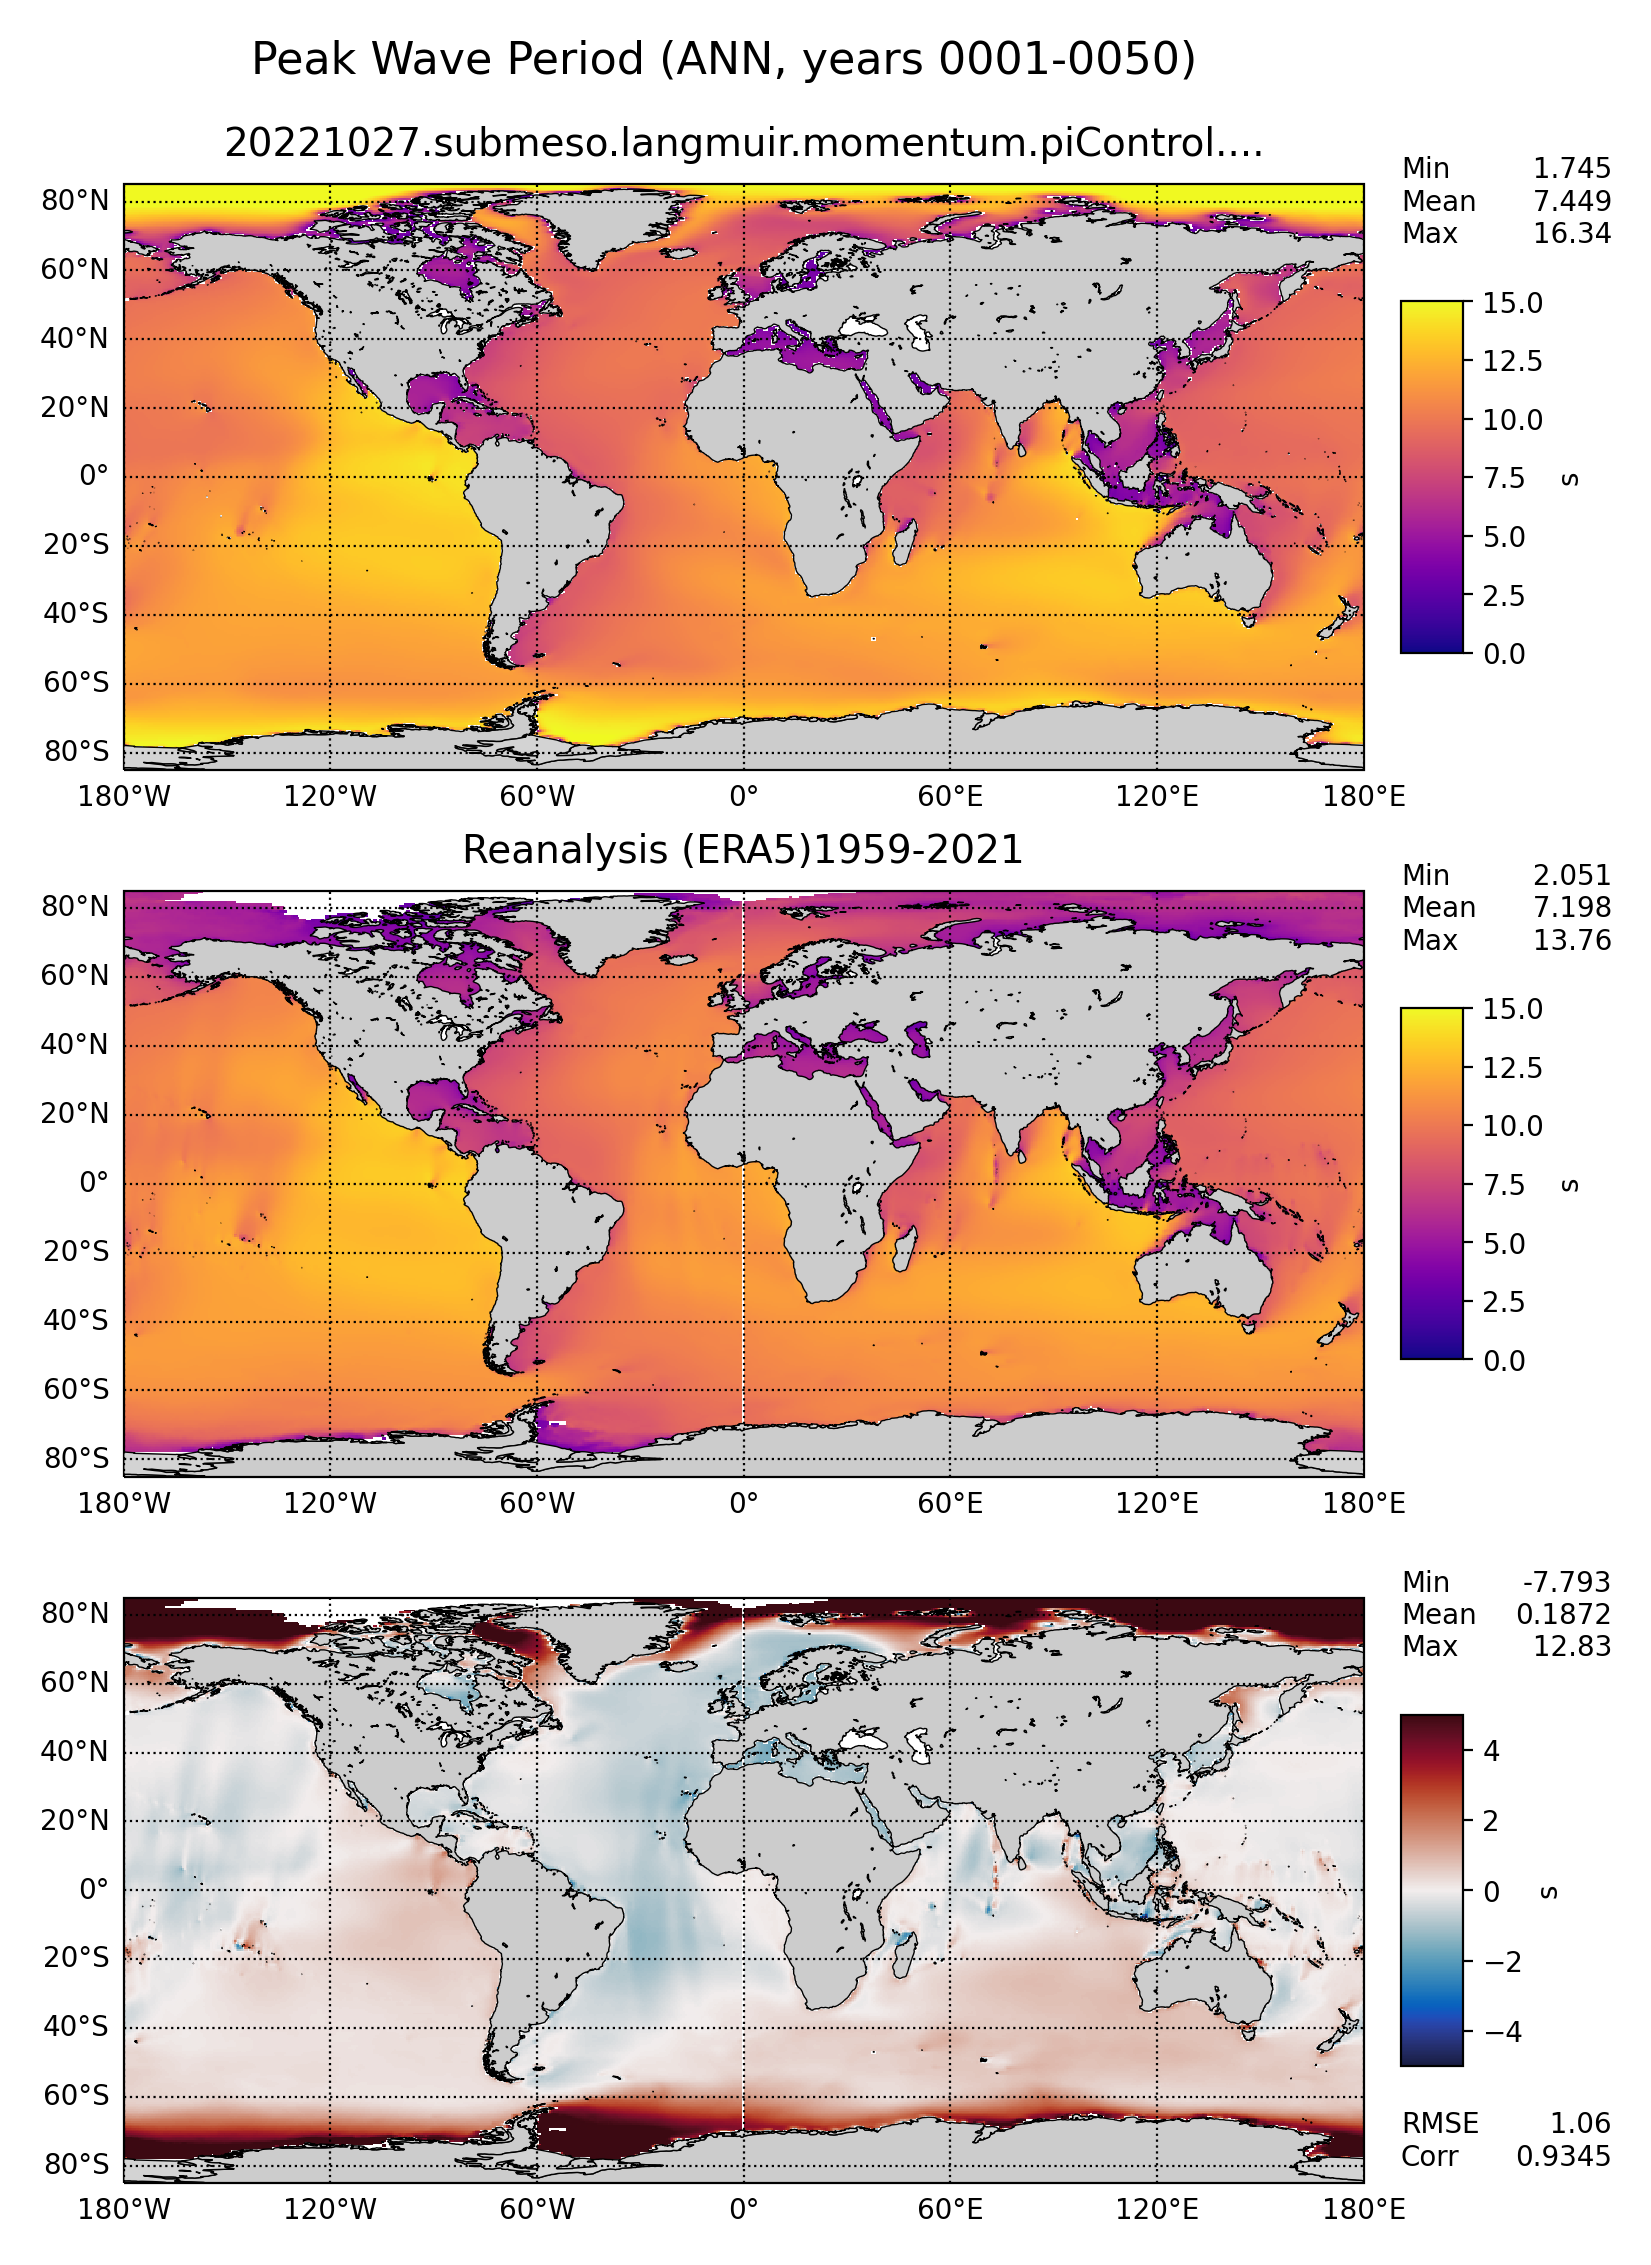
An analysis task for comparison of global maps of wave quantities (significant wave height and peak period) against observations.
Component and Tags:
component: ocean
tags: climatology, horizontalMap, waves
Configuration Options
The following configuration options are available for this task:
[climatologyMapWaves]
## options related to plotting climatology maps of wave fields
## ERA5 climatological data

# comparison grid(s) on which to plot analysis
comparisonGrids = ['latlon']

# Months or seasons to plot (Jan, Feb, Mar, Apr, May, Jun, Jul, Aug, Sep, Oct,
# Nov, Dec, JFM, AMJ, JAS, OND, ANN)
seasons =  ['ANN', 'JFM', 'JAS']

# a list of fields to plot ('significantWaveHeight', 'peakWavePeriod')
fieldList = ['significantWaveHeight', 'peakWavePeriod']

era5ObsStartYear = 1959
era5ObsEndYear = 2021
sscciObsStartYear = 1991
sscciObsEndYear = 2018

[climatologyMapWavesSignificantWaveHeight]
## options related to plotting climatology maps of significant wave height

# colormap for model/observations
colormapNameResult = viridis
# whether the colormap is indexed or continuous
colormapTypeResult = continuous
# the type of norm used in the colormap
normTypeResult = linear
# A dictionary with keywords for the norm
normArgsResult = {'vmin': 0., 'vmax': 7.}
# place the ticks automatically by default
# colorbarTicksResult = numpy.linspace(-2., 10., 9)

# colormap for differences
colormapNameDifference = balance
# whether the colormap is indexed or continuous
colormapTypeDifference = continuous
# the type of norm used in the colormap
normTypeDifference = linear
# A dictionary with keywords for the norm
normArgsDifference = {'vmin': -5., 'vmax': 5.}
# place the ticks automatically by default
# colorbarTicksDifference = numpy.linspace(-5., 5., 9)

[climatologyMapWavesPeakWavePeriod]
## options related to plotting climatology maps of peak wave frequency

# colormap for model/observations
colormapNameResult = plasma
# whether the colormap is indexed or continuous
colormapTypeResult = continuous
# the type of norm used in the colormap
normTypeResult = linear
# A dictionary with keywords for the norm
normArgsResult = {'vmin': 0.0, 'vmax':15.0}
# place the ticks automatically by default
# colorbarTicksResult = numpy.linspace(-2., 10., 9)

# colormap for differences
colormapNameDifference = balance
# whether the colormap is indexed or continuous
colormapTypeDifference = continuous
# the type of norm used in the colormap
normTypeDifference = linear
# A dictionary with keywords for the norm
normArgsDifference = {'vmin': -5., 'vmax': 5.}
# place the ticks automatically by default
# colorbarTicksDifference = numpy.linspace(-5., 5., 9)
- For more details, see:
Observations
Wave Reanalysis: ERA5 Wave Satelite Altimeter Observations: ESA Sea State Climate Change Initiative
Example Result