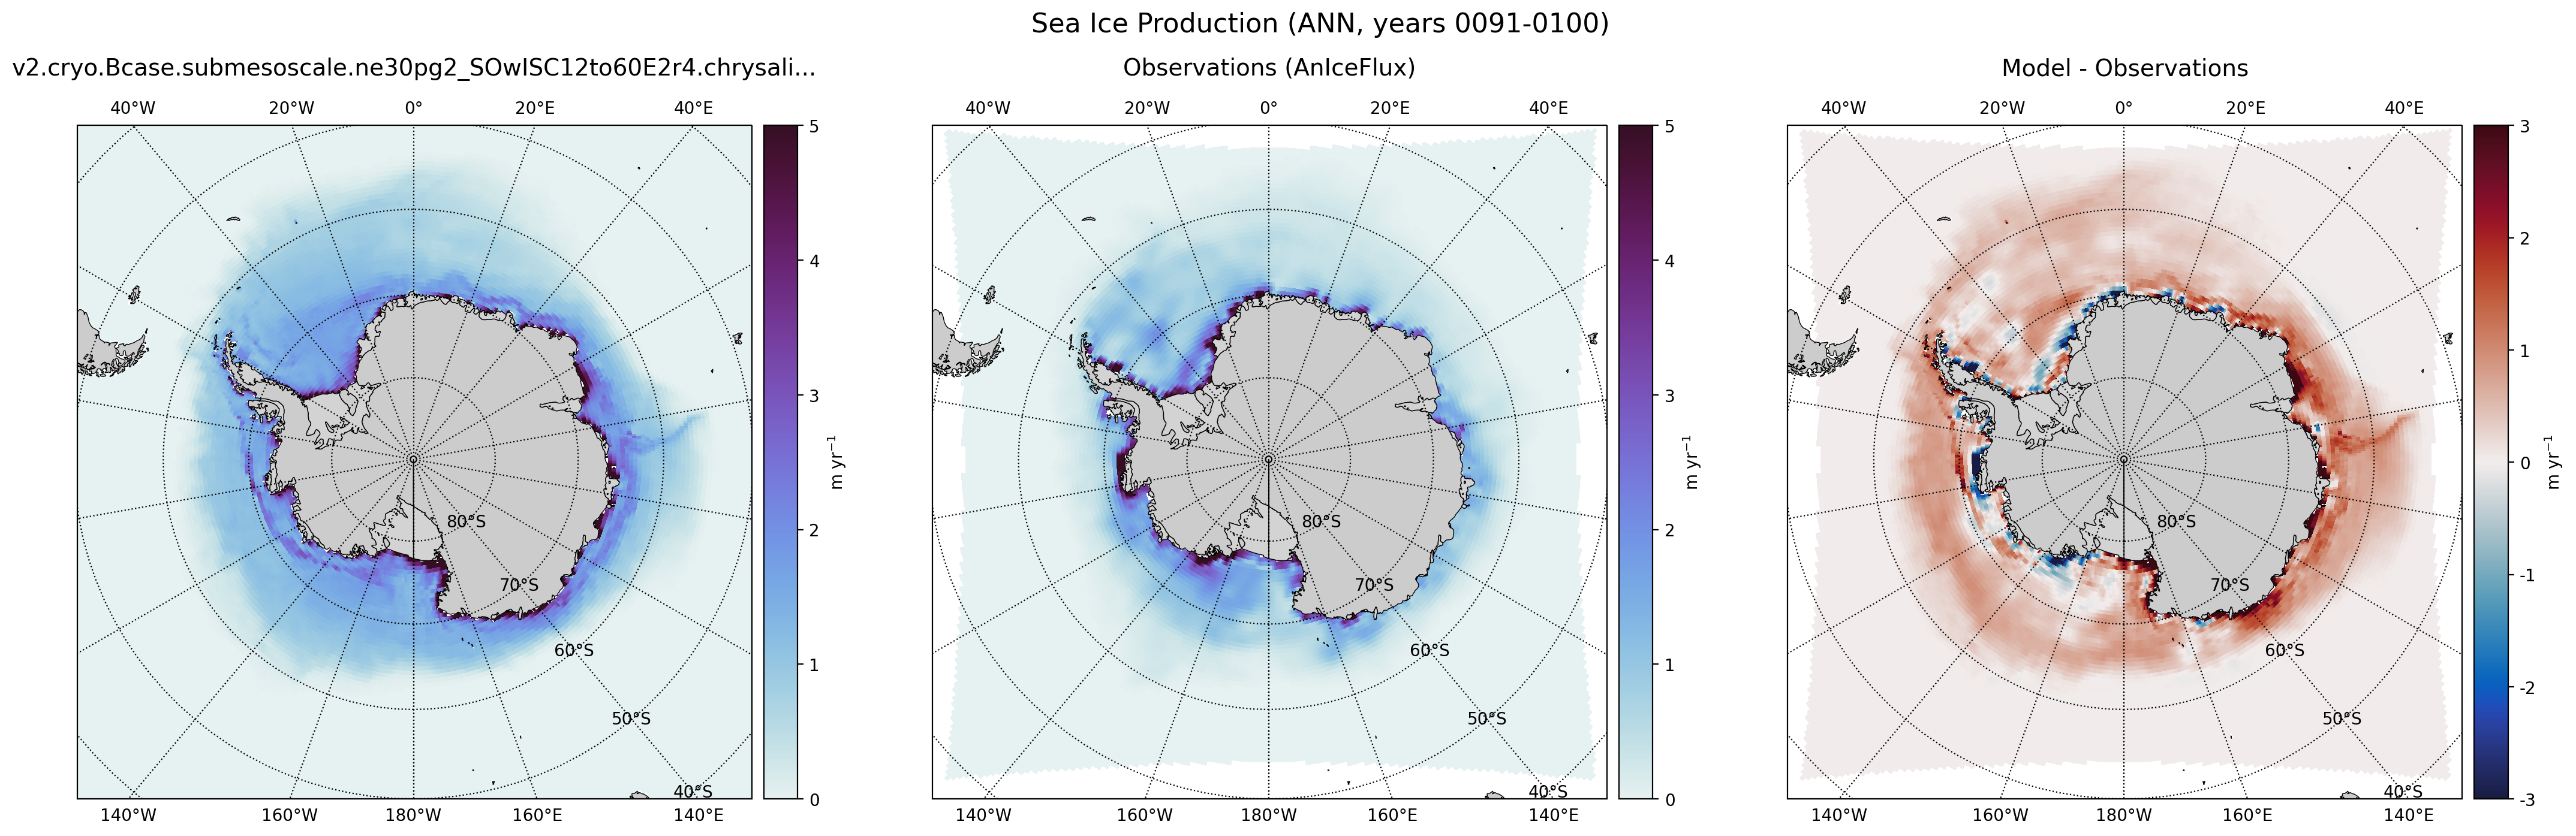
climatologyMapSeaIceProductionSH
An analysis task for plotting maps of Antarctic sea ice production against observations.
Component and Tags:
component: seaIce
tags: climatology, horizontalMap, seaIceProduction, publicObs
Configuration Options
The following configuration options are available for this task:
[climatologyMapSeaIceProductionSH]
# options related to plotting horizontally remapped climatologies of
# sea ice production against control model results and observations
# in the southern hemisphere (SH)

# colormap for model/observations
colormapNameResult = dense
# whether the colormap is indexed or continuous
colormapTypeResult = continuous
# the type of norm used in the colormap
normTypeResult = linear
# A dictionary with keywords for the norm
normArgsResult = {'vmin': 0., 'vmax': 5.}
# place the ticks automatically by default
# colorbarTicksResult = numpy.linspace(-2., 2., 9)

# colormap for differences
colormapNameDifference = balance
# whether the colormap is indexed or continuous
colormapTypeDifference = continuous
# the type of norm used in the colormap
normTypeDifference = linear
# A dictionary with keywords for the norm
normArgsDifference = {'vmin': -3., 'vmax': 3.}
# place the ticks automatically by default
colorbarTicksDifference = [-3, -2, -1, 0, 1, 2, 3]

# Times for comparison times
seasons =  ['ANN', 'DJF', 'JJA']

# comparison grid(s) ('latlon', 'antarctic') on which to plot analysis
comparisonGrids = ['latlon']

# reference lat/lon for sea ice plots in the northern hemisphere
minimumLatitude = -50
referenceLongitude = 180

# arrange subplots vertically?
vertical = False

# observations files
productionSH = AnIceFlux/aniceflux_v01_clim_mean_1982-2008.nc
The option minimumLatitude determines what the northernmost latitude (in
degrees) included in the plot will be. The option referenceLongitude
defines which longitude will be at the bottom of the plot.
By default, plots are produced comparing modeled sea ice production against
AnIceFlux (annual climatology only).
The option vertical = True can be used to plot 3 panels one above another
(resulting in a tall, thin image) rather than next to each other, the default
(resulting in a short, wide image).
- For details on the remaining configration options, see:
Observations
Example Result