regionalTSDiagrams
An analysis task for plotting T-S (potential temperature vs. salinity) diagrams of climatologies in ocean regions.
Component and Tags:
component: ocean
tags: climatology, regions, publicObs
Configuration Options
The following configuration options are available for this task:
[regionalTSDiagrams]
## options related to plotting T/S diagrams of ocean regions

# the names of region groups to plot, each with its own section below
regionGroups = ['Ocean Basins']

# a list of seasons to compute climatologies over
seasons = ['ANN']

# the number of threads dask is allowed to spawn for each process computing
# the observational climatologies
# Decrease this number if regionalTSDiagrams subtasks are running
# out of available threads
daskThreads = 8

# the number of subprocesses that each observational climatology subtask gets
# counted as occupying
# Increase this number if regionalTSDiagrams subtasks are running
# out of memory, and fewer tasks will be allowed to run at once
subprocessCount = 4

[TSDiagramsForAntarcticRegions]
## options related to plotting T/S diagrams of Antarctic regions

# list of regions to plot or ['all'] for all regions in the masks file.
# See "regionNames" in the antarcticRegions masks file in
# regionMaskSubdirectory for details.
regionNames = []

# diagram type, either 'volumetric' or 'scatter', depending on if the points
# should be binned the plot should show the volume fraction in each bin or
# scattered points colored by their depth
diagramType = volumetric

# if diagramType == 'volumetric', the bin boundaries for T and S
# if diagramType == 'scatter', only the min and max are important (and the
#   bins are only used for computing neutral density contours)
Tbins = numpy.linspace(-2.5, 4, 131)
Sbins = numpy.linspace(33.8, 34.8, 201)

# density contour interval
rhoInterval = 0.1

# The color map for depth or volume
colormap = cmo.deep
# The following is more appropriate if diagramType == 'scatter'
# colormap = cmo.deep_r
# the type of norm used in the colormap {'linear', 'log'}
normType = log

# The minimum and maximum depth over which fields are plotted, default is
# to take these values from the geojson feature's zmin and zmax properties.
# Add these to a custom config file to override the defaults.
# zmin = -1000
# zmax = -400

# the minimum and maximum volume for the colorbar, default is the minimum and
# maximum over the mode output
# volMin = 3e9
# volMax = 1e12

# Obserational data sets to compare against
obs = ['SOSE', 'WOA18']

[TSDiagramsForOceanBasins]
## options related to plotting T/S diagrams of major ocean basins

# list of regions to plot or ['all'] for all regions in the masks file.
# See "regionNames" in the oceanBasins masks file in
# regionMaskSubdirectory for details.
regionNames = ["Atlantic_Basin", "Pacific_Basin", "Indian_Basin",
               "Arctic_Basin", "Southern_Ocean_Basin", "Mediterranean_Basin",
               "Global Ocean", "Global Ocean 65N to 65S",
               "Global Ocean 15S to 15N"]

# diagram type, either 'volumetric' or 'scatter', depending on if the points
# should be binned the plot should show the volume fraction in each bin or
# scattered points colored by their depth
diagramType = volumetric

# if diagramType == 'volumetric', the bin boundaries for T and S
# if diagramType == 'scatter', only the min and max are important (and the
#   bins are only used for computing neutral density contours)
Tbins = numpy.linspace(-2.5, 16, 926)
Sbins = numpy.linspace(33.8, 35.8, 1001)

# density contour interval
rhoInterval = 0.2

# The color map for depth or volume
colormap = white_cmo_deep
# The following is more appropriate if diagramType == 'scatter'
# colormap = cmo.deep_r
# the type of norm used in the colormap {'linear', 'log'}
normType = log

# The minimum and maximum depth over which fields are plotted.
zmin = -1000
zmax = 0

# Obserational data sets to compare against
obs = ['WOA18']
Similar config sections are included for other region groups.
Region Groups
A list of groups of regions, each of which will get its own gallery on
the resulting analysis web page. See Region Groups for
more information on the available region groups. For each region group, there
should be a corresponding TSDiagramsFor<RegionGroup> section of the config
file, with any spaces removed from the name of the region group. By default,
the only region group is 'Ocean Basins'.
Region Names
The regionNames can be set to ['all'] to plot all of the
regions in the geojson file. In the case of Antarctic Regions, these
are:
["Southern Ocean", "Southern Ocean 60S", "Eastern Weddell Sea Shelf",
 "Eastern Weddell Sea Deep", "Western Weddell Sea Shelf",
 "Western Weddell Sea Deep", "Weddell Sea Shelf", "Weddell Sea Deep",
 "Bellingshausen Sea Shelf", "Bellingshausen Sea Deep", "Amundsen Sea Shelf",
 "Amundsen Sea Deep", "Eastern Ross Sea Shelf", "Eastern Ross Sea Deep",
 "Western Ross Sea Shelf", "Western Ross Sea Deep",
 "East Antarctic Seas Shelf", "East Antarctic Seas Deep"]
For Ocean Basins, they are:
["Atlantic_Basin", "Pacific_Basin", "Indian_Basin", "Arctic_Basin",
 "Southern_Ocean_Basin", "Mediterranean_Basin", "Global Ocean",
 "Global Ocean 65N to 65S", "Global Ocean 15S to 15N"]
Diagram Type
By default, a “volumetric” diagram is produced, where the volume of ocean water in a region is binned in T and S space, and the volume of each bin is plotted. This allows for more quantitative comparison with observation- and model-based climatologies.
If diagramType is set to scatter, a point cloud is plotted instead,
shaded by depth. We anticipate that this will useful for plotting data sets
that are spatially scattered (e.g. the MEOP seal data), because each sample
does not correspond to a volume. This type of diagram may also be helpful for
comparison with publications that use scatter plots.
For volumetric diagrams, two norms for the continuous color map are supported,
linear and log, with log being the default. The range of the
colormap is is between zero and the maximum bin volume for linear and
between the minimum non-zero bin volume and the max for log. The min/max
bin volume is taken from the first panel containing the “main” MPAS-Ocean plot,
and the same color map range is used for all panels.
Bins and Contour Intervals
If diagramType = volumetric, the number and spacing of potential
temperature and salinity bins is set in Tbins and Sbins. For
diagramType = scatter, Tbins and Sbins are used to make contour
plots of neutral density and are used to determine the bounds of the figure
in T/S space. rhoInterval is the interval between contours of neutral
density. zmin and zmax are the minimum and maximum depths (positive
up) of the ocean region. If available (e.g. for “Antarctic Regions”), the
default is to read them from geojson file.
Observations
The obs option contains a list of the names of observational data sets.
Currently, “SOSE” and “WOA18” are the only data sets available, but we
anticipate adding several additional data sets in the near future.
2005-2010 climatology from SOSE the Southern Ocean State Estimate (SOSE) WOA18 Temperature and Salinity Climatology
Other Config Options
- For more details on the remaining config options, see
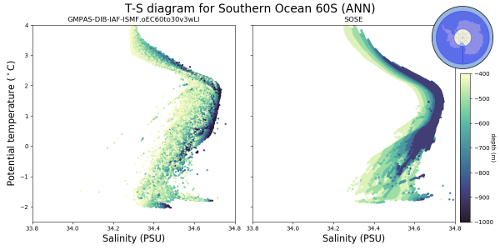
Example Result