streamfunctionMOC
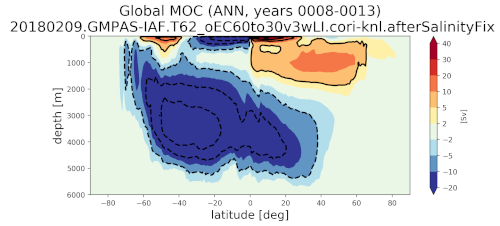
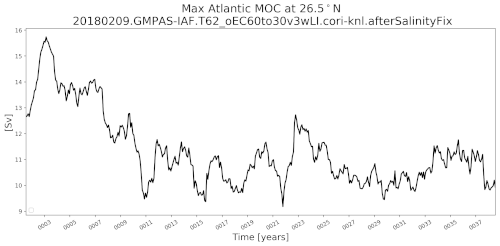
An analysis task for plotting the zonal mean meridional overturning circulation (MOC). Currently we support plots of the global and Atlantic MOCs but not of other regions (notably the Indo-pacific). This task also produces a time series plot of the maximum Atlantic MOC at 26.5°N.
Component and Tags:
component: ocean
tags: streamfunction, moc, climatology, timeSeries, publicObs
Configuration Options
The following configuration options are available for this task:
[streamfunctionMOC]
## options related to plotting the streamfunction of the meridional overturning
## circulation (MOC)

# Include the bolus velocity from the Gent-McWilliams parameterization?  This
# only needs to be disabled if the simulation was run with GM turned on but
# the MOC shouldn't include the bolus term
includeBolus = True

# Region names for basin MOC calculation.
# Supported options are Atlantic and IndoPacific
regionNames = ['Atlantic']

# Size of latitude bins over which MOC streamfunction is integrated
latBinSizeGlobal = 1.
latBinSizeAtlantic = 0.5
latBinSizeIndoPacific = 0.5

# colormap for model results
colormapNameGlobal = RdYlBu_r
colormapNameAtlantic = RdYlBu_r
colormapNameIndoPacific = RdYlBu_r
# colormap indices for contour color
colormapIndicesGlobal = [0, 40, 80, 110, 140, 170, 200, 230, 255]
colormapIndicesAtlantic = [0, 40, 80, 110, 140, 170, 200, 230, 255]
colormapIndicesIndoPacific = [0, 40, 80, 110, 140, 170, 200, 230, 255]
# colorbar levels/values for contour boundaries
colorbarLevelsGlobal = [-20, -10, -5, -2, 2, 5, 10, 20, 30, 40]
colorbarLevelsAtlantic = [-10, -5, -2, 0, 5, 8, 10, 14, 18, 22]
colorbarLevelsIndoPacific = [-10, -5, -2, 0, 5, 8, 10, 14, 18, 22]
# contour line levels
contourLevelsGlobal = np.arange(-25.1, 35.1, 10)
contourLevelsAtlantic = np.arange(-8, 20.1, 2)
contourLevelsIndoPacific = np.arange(-8, 20.1, 2)

# Number of points over which to compute moving average for
# MOC timeseries (e.g., for monthly output, movingAveragePoints=12
# corresponds to a 12-month moving average window)
movingAveragePoints = 12

# Number of points over which to compute moving average (with respect to
# latitude) for climatological MOC plots
movingAveragePointsClimatological = 1

# An optional first year for the tick marks on the x axis. Leave commented out
# to start at the beginning of the time series.

# firstYearXTicks = 1

# An optional number of years between tick marks on the x axis.  Leave
# commented out to determine the distance between ticks automatically.

# yearStrideXTicks = 1
For runs that use an eddy closure parameterization, tracer transport is
augmented with the Bolus velocity. By default, the Bolus velocity is included
in the MOC but this can be disabled with includeBolus = False.
(MPAS-Analysis will automatically recognize runs where the bolus velocity is
not used and will not include it in climatology computations or add it to the
MOC in these cases to save disk space and computation time.)
Currently, the only supported region is the Atlantic, so regionNames should
be left as it is. In the near future, we anticipate including the Indo-pacific
as well.
Each region has its own bin size (in degrees latitudes). Adjust these as desired, e.g.:
latBinSizeGlobal = 0.5
for half-degree bins for the global MOC.
Each region supports its own colormap, with suffix Global, Atlantic
and (soon) IndoPacific. See Colormaps for more details.
The MOC time series is plotted with a 12-month moving average by default (taking out noise and the annual cycle). For more details, see Moving Average.
The latitude-depth MOC plots can also optionally be smoothed in latitude with a moving average, e.g.:
movingAveragePointsClimatological = 4
will perform a 4-bin smoothing of the MOC.
For more details on the remaining config options, see Time-Axis Tick Marks.
Example Result