oceanRegionalProfiles
An analysis task for plotting depth profiles of temperature, salinity, potential density, etc. averaged over regions and in time. The plots also include a measure of variability (the standard deviation in space and time).
Component and Tags:
component: ocean
tags: profiles, climatology
Configuration Options
The following configuration options are available for this task:
[oceanRegionalProfiles]
## options related to plotting vertical profiles of regional means (and
## variability) of 3D MPAS fields

# The name of a region group defining the region for each profile
regionGroups = ['Ocean Basins']


[profilesOceanBasins]
## options related to plotting vertical profiles ocean basins

# a list of dictionaries for each field to plot.  The dictionary includes
# prefix (used for file names, task names and sections) as well as the mpas
# name of the field, units for colorbars and a the name as it should appear
# in figure titles and captions.
fields =
    [{'prefix': 'potentialTemperature',
      'mpas': 'timeMonthly_avg_activeTracers_temperature',
      'units': r'$\degree$C',
      'titleName': 'Potential Temperature'},
     {'prefix': 'salinity',
      'mpas': 'timeMonthly_avg_activeTracers_salinity',
      'units': r'PSU',
      'titleName': 'Salinity'},
     {'prefix': 'potentialDensity',
      'mpas': 'timeMonthly_avg_potentialDensity',
      'units': r'kg m$^{-3}$',
      'titleName': 'Potential Density'}]

# Times for comparison times (Jan, Feb, Mar, Apr, May, Jun, Jul, Aug, Sep, Oct,
# Nov, Dec, JFM, AMJ, JAS, OND, ANN)
seasons =  ['JFM', 'JAS', 'ANN']

# minimum and maximum depth of profile plots, or empty for the full depth range
depthRange = []

# a list of region names from the region masks file to plot
regionNames = ["Atlantic_Basin", "Pacific_Basin", "Indian_Basin",
               "Arctic_Basin", "Southern_Ocean_Basin", "Mediterranean_Basin",
               "Global Ocean", "Global Ocean 65N to 65S",
               "Global Ocean 15S to 15N"]

# web gallery options
profileGalleryGroup = Ocean Basin Profiles
The [oceanRegionalProfiles] section contains a list of regionGroups,
one or more of the Region Groups defined in
geometric_features.aggregation.get_aggregator_by_name().
For each region group, there is a corresponding section
[profiles<RegionGroup>], where <RegionGroup> is the name of the region
group with spaces removed. In this section, the fields dictionary is used
to specify a list of 3D MPAS fields to average and plot. The key prefix is
a convenient name appended to tasks and file names to describe the field.
mpas is the name of the field in MPAS timeSeriesStatsMonthly output
files. The units are the SI units of the field to include on the plot’s x
axis and titleName is the name of the field to use in its gallery name and
on the x axis of the profile.
regionNames is a list of regions from the full the region group or
regionNames = ['all'] to indicate that all regions should be used. For
the available regions, see
Aggregate Existing Features.
A config option is available to specify the names of the gallery group for the
profiles (profileGalleryGroup).
A minimum and maximum depth for profiles can be specified with depthRange.
The default is the full range.
- For more details on the remaining config options, see
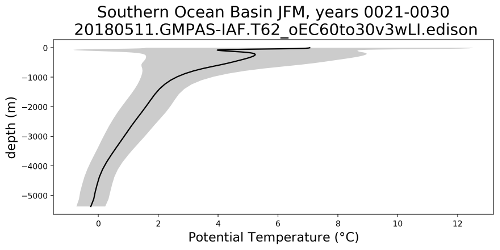
Example Result