climatologyMapSSS
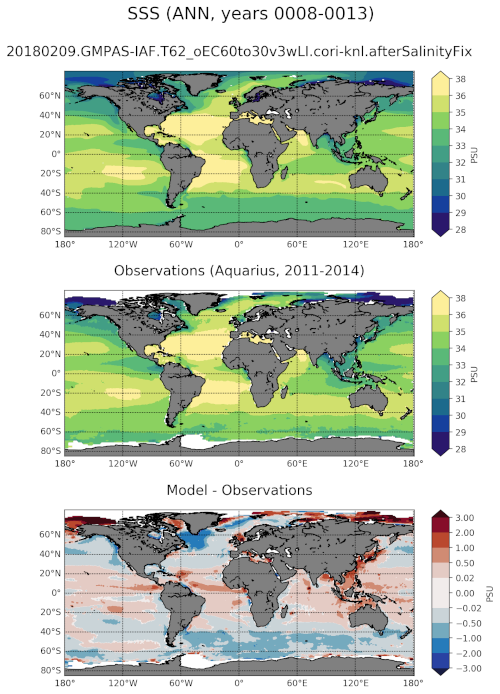
An analysis task for comparison of global maps of sea surface salinity (SSS) against observations.
Component and Tags:
component: ocean
tags: climatology, horizontalMap, sss, publicObs
Configuration Options
The following configuration options are available for this task:
[climatologyMapSSS]
## options related to plotting horizontally remapped climatologies of
## sea surface salinity (SSS) against reference model results and observations

# colormap for model/observations
colormapNameResult = haline
# color indices into colormapName for filled contours
colormapIndicesResult = [0, 40, 80, 110, 140, 170, 200, 230, 255]
# colormap levels/values for contour boundaries
colorbarLevelsResult = [28, 29, 30, 31, 32, 33, 34, 35, 36, 38]

# colormap for differences
colormapNameDifference = RdBu_r
# color indices into colormapName for filled contours
colormapIndicesDifference = [0, 28, 57, 85, 113, 128, 128, 142, 170, 198,
                             227, 255]
# colormap levels/values for contour boundaries
colorbarLevelsDifference = [-3, -2, -1, -0.5, -0.02, 0,  0.02, 0.5, 1, 2, 3]

# Times for comparison times (Jan, Feb, Mar, Apr, May, Jun, Jul, Aug, Sep,
# Oct, Nov, Dec, JFM, AMJ, JAS, OND, ANN)
seasons =  ['JFM', 'JAS', 'ANN']

# comparison grid(s) ('latlon', 'antarctic') on which to plot analysis
comparisonGrids = ['latlon']
- For more details, see:
Observations
Example Result