climatologyMapVel
An analysis task for plotting velocity climatologies at various depths. Comparison against observations is not yet supported.
Component and Tags:
component: ocean
tags: climatology, horizontalMap, climatologyMapVel
Configuration Options
The following configuration options are available for this task:
[climatologyMapVel]
## options related to plotting climatology maps of Antarctic fields at
## various levels, including the sea floor against control model results
## and SOSE reanalysis data

# comparison grid(s)
# only the Antarctic really makes sense but lat-lon could technically work.
comparisonGrids = ['latlon']

# Months or seasons to plot (Jan, Feb, Mar, Apr, May, Jun, Jul, Aug, Sep,
# Oct, Nov, Dec, JFM, AMJ, JAS, OND, ANN)
seasons =  ['ANN']

# list of depths in meters (positive up) at which to analyze, 'top' for the
# sea surface, 'bot' for the sea floor
depths = ['top', -200, -400, -600, -800, -1000, -1500, -2000, 'bot']

# a list of fields top plot for each transect.  All supported fields are
# listed below
fieldList = ['zonalVelocity', 'meridionalVelocity', 'velocityMagnitude']

# set the suffix for files, e.g. if you want to use a different comparison
# grid from the default
fileSuffix = latlon

# depth separating shallow from deep color maps
shallowVsDeepColormapDepth = -200

# colormap for model/observations
colormapNameResult = delta
# whether the colormap is indexed or continuous
colormapTypeResult = continuous
# the type of norm used in the colormap
normTypeResult = linear
# A dictionary with keywords for the norm
normArgsResult = {'vmin': -0.2, 'vmax': 0.2}


[climatologyMapVel_VelocityMagnitudeShallow]

# colormap for model/observations
colormapNameResult = ice
# whether the colormap is indexed or continuous
colormapTypeResult = continuous
# the type of norm used in the colormap
normTypeResult = log
# A dictionary with keywords for the norm
normArgsResult = {'vmin': 1.e-3, 'vmax': 1.}


[climatologyMapVel_VelocityMagnitudeDeep]

# colormap for model/observations
colormapNameResult = ice
# whether the colormap is indexed or continuous
colormapTypeResult = continuous
# the type of norm used in the colormap
normTypeResult = log
# A dictionary with keywords for the norm
normArgsResult = {'vmin': 1.e-4, 'vmax': 5.e-1}
There is a section for options that apply to all velocity climatology maps and up to two for each field for specifying the color maps at shallow and deep depths.
The option depths is a list of (approximate) depths at which to sample
the potential temperature field. A value of 'top' indicates the sea
surface (or the ice-ocean interface under ice shelves) while a value of
'bot' indicates the seafloor.
The user can select only to plot a subset of the supported fields by adding
only the desired field names to fieldList. The default value shows the
list of all available fields.
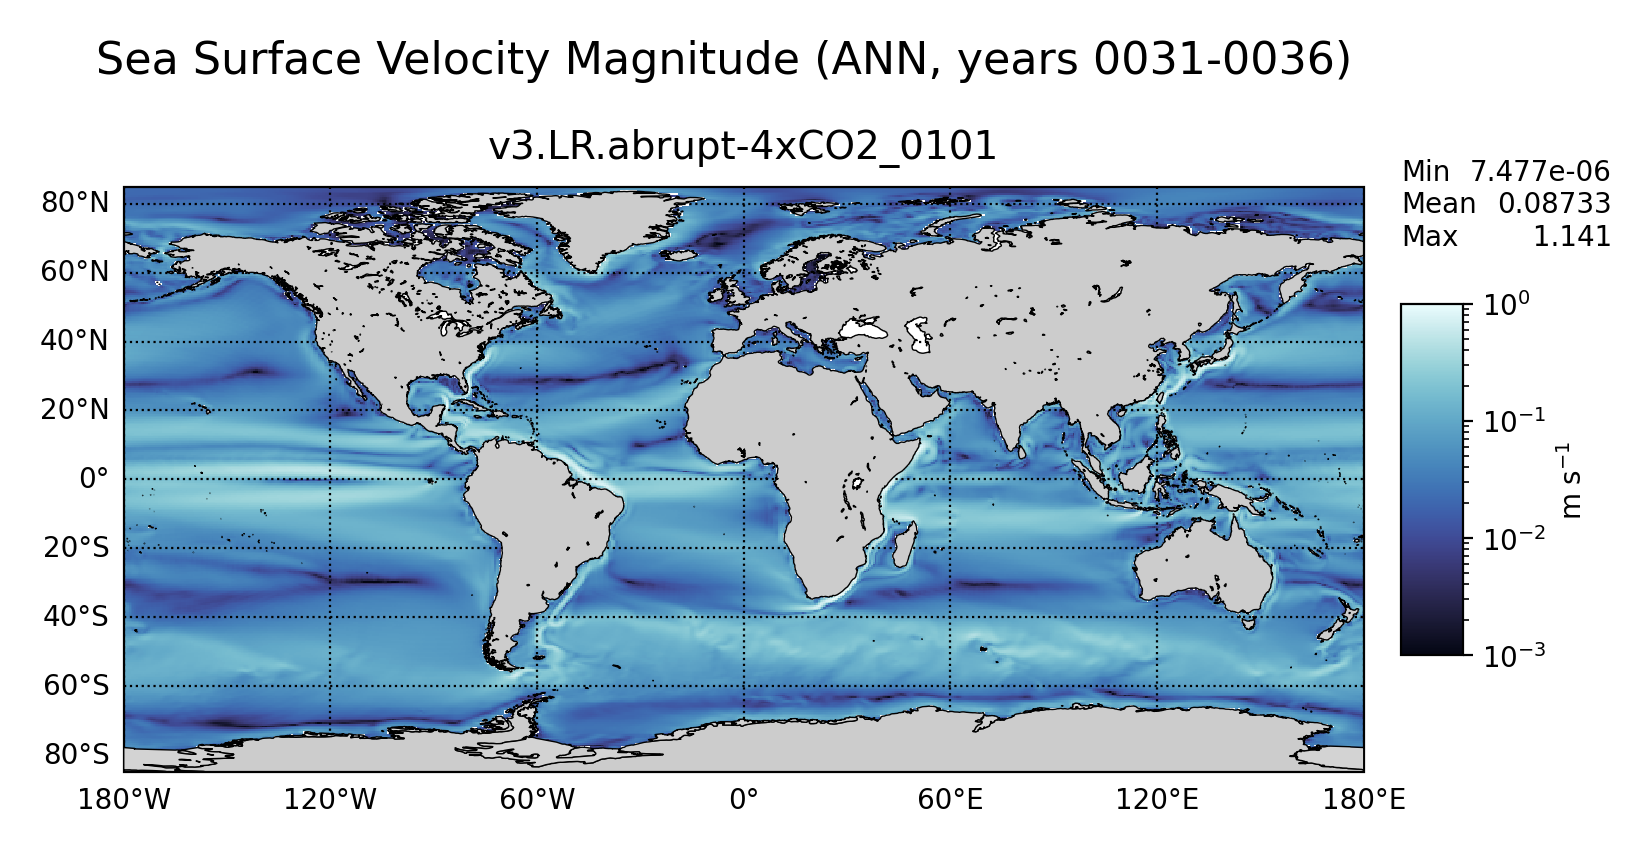
Example Result