timeSeriesSST
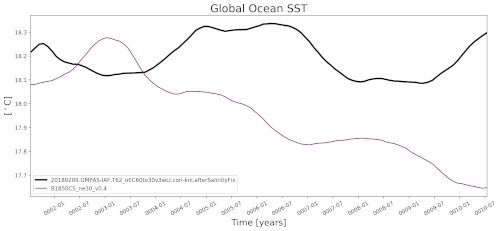
An analysis task for plotting a time series of sea surface temperature (SST), optionally against results from a preprocessed E3SM v0 run (see Runs).
Component and Tags:
component: ocean
tags: timeSeries, sst, publicObs
Configuration Options
The following configuration options are available for this task:
[timeSeriesSST]
## options related to plotting time series of sea surface temperature (SST)

# list of regions to plot from the region list in [regions] below
regions = ['global']

# Number of points over which to compute moving average (e.g., for monthly
# output, movingAveragePoints=12 corresponds to a 12-month moving average
# window)
movingAveragePoints = 12

# An optional first year for the tick marks on the x axis. Leave commented out
# to start at the beginning of the time series.

# firstYearXTicks = 1

# An optional number of years between tick marks on the x axis.  Leave
# commented out to determine the distance between ticks automatically.

# yearStrideXTicks = 1
- For more details on these config options, see:
Example Result