climatologyMapSST
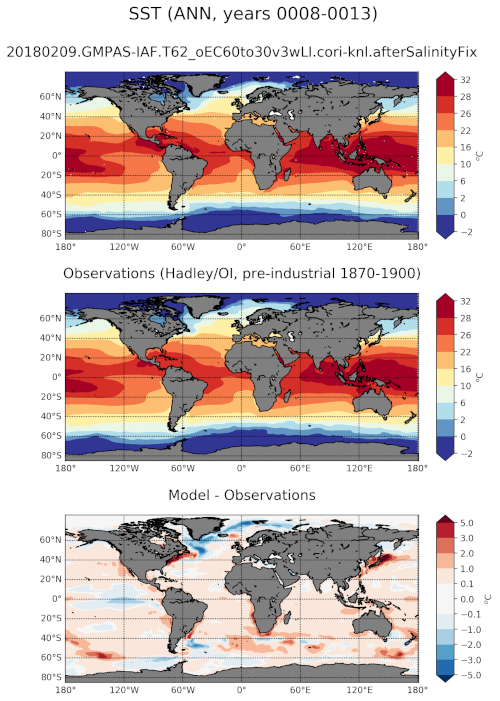
An analysis task for comparison of global maps of sea surface temperature (SST) against observations.
Component and Tags:
component: ocean
tags: climatology, horizontalMap, sst, publicObs
Configuration Options
The following configuration options are available for this task:
[climatologyMapSST]
## options related to plotting horizontally remapped climatologies of
## sea surface temperature (SST) against reference model results and
## observations

# colormap for model/observations
colormapNameResult = RdYlBu_r
# color indices into colormapName for filled contours
colormapIndicesResult = [0, 40, 80, 110, 140, 170, 200, 230, 255]
# colormap levels/values for contour boundaries
colorbarLevelsResult = [-2, 0, 2, 6, 10, 16, 22, 26, 28, 32]

# colormap for differences
colormapNameDifference = RdBu_r
# color indices into colormapName for filled contours
colormapIndicesDifference = [0, 28, 57, 85, 113, 128, 128, 142, 170, 198,
                             227, 255]
# colormap levels/values for contour boundaries
colorbarLevelsDifference = [-5, -3, -2, -1, -0.1, 0, 0.1, 1, 2, 3, 5]

# Times for comparison times (Jan, Feb, Mar, Apr, May, Jun, Jul, Aug, Sep,
# Oct, Nov, Dec, JFM, AMJ, JAS, OND, ANN)
seasons =  ['JFM', 'JAS', 'ANN']

# comparison grid(s) ('latlon', 'antarctic') on which to plot analysis
comparisonGrids = ['latlon']

# first and last year of SST observational climatology (preferably one of the
# two ranges given below)
# values for preindustrial
obsStartYear = 1870
obsEndYear = 1900
# alternative values for present day
#obsStartYear = 1990
#obsEndYear = 2011
By default, a “preindustrial” climatology is computed for comparison with the
model results. For simulations covering a different time period, the range of
years (obsStartYear and obsEndYear) should be updated.
- For details on the remaining configuration options, see:
Observations
Example Result