woceTransects
An analysis task for interpolating MPAS fields to World Ocean Circulation Experiment (WOCE) transects and comparing them with ship-based observations.
Component and Tags:
component: ocean
tags: climatology, transect, woce
Configuration Options
The following configuration options are available for this task:
[woceTransects]
## options related to plotting model vs. World Ocean Circulation Experiment
## (WOCE) transects.

# Times for comparison times (Jan, Feb, Mar, Apr, May, Jun, Jul, Aug, Sep, Oct,
# Nov, Dec, JFM, AMJ, JAS, OND, ANN)
seasons =  ['ANN']

# The approximate horizontal resolution (in km) of each transect.  Latitude/
# longitude between observation points will be subsampled at this interval.
# Use 'obs' to indicate no subsampling.
horizontalResolution = obs

# The name of the vertical comparison grid.  Valid values are 'mpas' for the
# MPAS vertical grid, 'obs' to use the locations of observations or
# any other name if the vertical grid is defined by 'verticalComparisonGrid'
# verticalComparisonGridName = obs
verticalComparisonGridName = uniform_0_to_4000m_at_10m
#verticalComparisonGridName = mpas

# The vertical comparison grid if 'verticalComparisonGridName' is not 'mpas' or
# 'obs'.  This should be numpy array of (typically negative) elevations (in m).
verticalComparisonGrid = numpy.linspace(0, -4000, 401)

# The minimum weight of a destination cell after remapping. Any cell with
# weights lower than this threshold will therefore be masked out.
renormalizationThreshold = 0.01


[woceTemperatureTransects]
## options related to plotting WOCE transects of potential temperature

# colormap for model/observations
colormapNameResult = RdYlBu_r
# the type of norm used in the colormap (linear, log, or symLog)
normTypeResult = linear
# A dictionary with keywords for the norm
normArgsResult = {'vmin': 0.0, 'vmax': 18.0}
# color indices into colormapName for filled contours
#colormapIndicesResult = [0, 40, 80, 110, 140, 170, 200, 230, 255]
# colormap levels/values for contour boundaries
#colorbarLevelsResult = [0, 1, 2, 3, 4, 6, 8, 10, 14, 18]
# place the ticks automatically by default
# colorbarTicksResult = numpy.linspace(0.0, 18.0, 9)
# contour line levels
contourLevelsResult = np.arange(1.0, 18.0, 2.0)

# colormap for differences
colormapNameDifference = RdBu_r
# the type of norm used in the colormap (linear, log, or symLog)
normTypeDifference = linear
# A dictionary with keywords for the norm
normArgsDifference = {'vmin': -2.0, 'vmax': 2.0}
# color indices into colormapName for filled contours
#colormapIndicesDifference = [0, 28, 57, 85, 113, 128, 128, 142, 170, 198, 227, 255]
# colormap levels/values for contour boundaries
#colorbarLevelsDifference = [-2, -1.5, -1.25, -1, -0.2, 0, 0.2, 1, 1.25, 1.5, 2]
# place the ticks automatically by default
# colorbarTicksDifference = numpy.linspace(-2.0, 2.0, 9)
# contour line levels
contourLevelsDifference = np.arange(-1.8, 2.0, 0.4)


[woceSalinityTransects]
## options related to plotting WOCE transects of salinity

# colormap for model/observations
colormapNameResult = BuOr
# the type of norm used in the colormap (linear, log, or symLog)
normTypeResult = linear
# A dictionary with keywords for the norm
normArgsResult = {'vmin': 33.0, 'vmax': 36.0}
# color indices into colormapName for filled contours
#colormapIndicesResult = [0, 40, 80, 110, 140, 170, 200, 230, 255]
# colormap levels/values for contour boundaries
#colorbarLevelsResult = [33, 34, 34.25, 34.5, 34.6, 34.7, 34.8, 34.9, 35, 36]
# place the ticks automatically by default
# colorbarTicksResult = numpy.linspace(33.0, 36.0, 9)
# contour line levels
contourLevelsResult = np.arange(33.3, 36.0, 0.3)

# colormap for differences
colormapNameDifference = RdBu_r
# the type of norm used in the colormap (linear, log, or symLog)
normTypeDifference = linear
# A dictionary with keywords for the norm
normArgsDifference = {'vmin': -1.0, 'vmax': 1.0}
# color indices into colormapName for filled contours
#colormapIndicesDifference = [0, 28, 57, 85, 113, 128, 128, 142, 170, 198, 227, 255]
# colormap levels/values for contour boundaries
#colorbarLevelsDifference = [-1, -0.5, -0.2, -0.05, -0.02, 0,  0.02, 0.05, 0.2, 0.5, 1]
# place the ticks automatically by default
# colorbarTicksDifference = numpy.linspace(-1.0, 1.0, 9)
# contour line levels
contourLevelsDifference = np.arange(-0.9, 1.0, 0.4)
- For details on these configuration options, see:
Observations
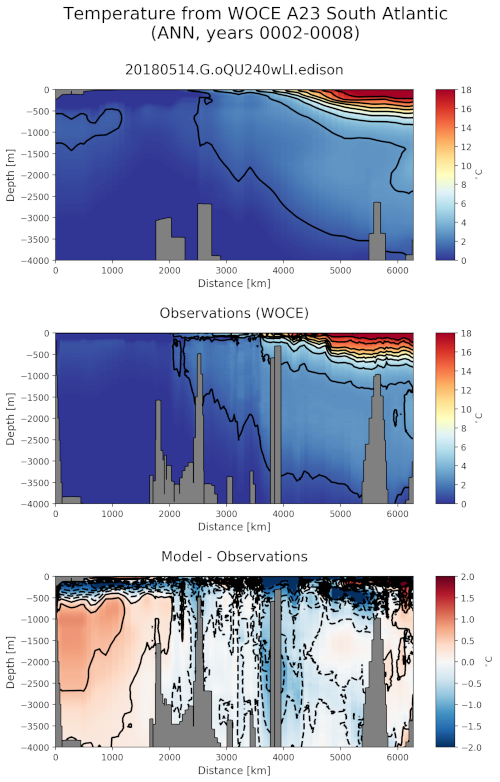
Example Result