soseTransects
An analysis task for computing meridional transects of MPAS fields at evenly spaced latitudes around Antarctica and comparing them with results from the Southern Ocean State Estimate (SOSE).
Component and Tags:
component: ocean
tags: climatology, transect, sose, publicObs
Configuration Options
The following configuration options are available for this task:
[soseTransects]
## options related to plotting model vs. Southern Ocean State Estimate (SOSE)
## transects.

# Times for comparison times (Jan, Feb, Mar, Apr, May, Jun, Jul, Aug, Sep, Oct,
# Nov, Dec, JFM, AMJ, JAS, OND, ANN)
seasons =  ['ANN']

# The approximate horizontal resolution (in km) of each transect.  Latitude/
# longitude between observation points will be subsampled at this interval.
# Use 'obs' to indicate no subsampling.
# horizontalResolution = obs
horizontalResolution = 5

# The name of the vertical comparison grid.  Valid values are 'mpas' for the
# MPAS vertical grid, 'obs' to use the locations of observations or
# any other name if the vertical grid is defined by 'verticalComparisonGrid'
# verticalComparisonGridName = mpas
# verticalComparisonGridName = obs
verticalComparisonGridName = uniform_0_to_4000m_at_10m

# The vertical comparison grid if 'verticalComparisonGridName' is not 'mpas' or
# 'obs'.  This should be numpy array of (typically negative) elevations (in m).
verticalComparisonGrid = numpy.linspace(0, -4000, 401)

# The minimum weight of a destination cell after remapping. Any cell with
# weights lower than this threshold will therefore be masked out.
renormalizationThreshold = 0.01

# min and max latitude of transects
minLat = -80
maxLat = -60

# longitudes of transects
longitudes = numpy.linspace(0, 330, 12)

# a list of fields top plot for each transect.  All supported fields are listed
# below.  Note that 'velocityMagnitude' cannot be plotted without
# 'zonalVelocity' and 'meridionalVelocity' because the components are needed
# to compute the magnitude.
fieldList = ['temperature', 'salinity', 'potentialDensity', 'zonalVelocity',
             'meridionalVelocity', 'velocityMagnitude']


[soseTemperatureTransects]
## options related to plotting SOSE transects of potential temperature

# colormap for model/observations
colormapNameResult = RdYlBu_r
# the type of norm used in the colormap
normTypeResult = linear
# A dictionary with keywords for the norm
normArgsResult = {'vmin': 0.0, 'vmax': 6.0}
# color indices into colormapName for filled contours
#colormapIndicesResult = [0, 40, 80, 110, 140, 170, 200, 230, 255]
# colormap levels/values for contour boundaries
#colorbarLevelsResult = [0, 0.25, 0.5, 0.75, 1, 2, 3, 4, 5, 6]
# place the ticks automatically by default
# colorbarTicksResult = numpy.linspace(0.0, 6.0, 9)
# contour line levels
contourLevelsResult = np.arange(0.5, 6.0, 1.0)

# colormap for differences
colormapNameDifference = balance
# the type of norm used in the colormap
normTypeDifference = linear
# A dictionary with keywords for the norm
normArgsDifference = {'vmin': -2.0, 'vmax': 2.0}
# color indices into colormapName for filled contours
#colormapIndicesDifference = [0, 28, 57, 85, 113, 128, 128, 142, 170, 198, 227, 255]
# colormap levels/values for contour boundaries
#colorbarLevelsDifference = [-2, -1.5, -1.25, -1, -0.2, 0, 0.2, 1, 1.25, 1.5, 2]
# place the ticks automatically by default
# colorbarTicksDifference = numpy.linspace(-2.0, 2.0, 9)
# contour line levels
contourLevelsDifference = np.arange(-1.8, 2.0, 0.4)


[soseSalinityTransects]
## options related to plotting SOSE transects of salinity

# colormap for model/observations
colormapNameResult = haline
# the type of norm used in the colormap
normTypeResult = linear
# A dictionary with keywords for the norm
normArgsResult = {'vmin': 34.0, 'vmax': 35.0}
# color indices into colormapName for filled contours
#colormapIndicesResult = [0, 40, 80, 110, 140, 170, 200, 230, 255]
# colormap levels/values for contour boundaries
#colorbarLevelsResult = [34, 34.3, 34.5, 34.65, 34.675, 34.7, 34.725, 34.75, 34.8, 35]
# place the ticks automatically by default
# colorbarTicksResult = numpy.linspace(34.0, 35.0, 9)
# contour line levels
contourLevelsResult = np.arange(34.1, 35.0, 0.1)

# colormap for differences
colormapNameDifference = balance
# the type of norm used in the colormap
normTypeDifference = linear
# A dictionary with keywords for the norm
normArgsDifference = {'vmin': -0.5, 'vmax': 0.5}
# color indices into colormapName for filled contours
#colormapIndicesDifference = [0, 28, 57, 85, 113, 128, 128, 142, 170, 198, 227, 255]
# colormap levels/values for contour boundaries
#colorbarLevelsDifference = [-0.5, -0.2, -0.1, -0.05, -0.02, 0,  0.02, 0.05, 0.1, 0.2, 0.5]
# place the ticks automatically by default
# colorbarTicksDifference = numpy.linspace(-0.5, 0.5, 9)
# contour line levels
contourLevelsDifference = numpy.linspace(-0.6, 0.6, 9)


[sosePotentialDensityTransects]
## options related to plotting SOSE transects of potential density

# colormap for model/observations
colormapNameResult = Spectral_r
# the type of norm used in the colormap
normTypeResult = linear
# A dictionary with keywords for the norm
normArgsResult = {'vmin': 1026.5, 'vmax': 1028.}
# place the ticks automatically by default
# colorbarTicksResult = numpy.linspace(1026., 1028., 9)
contourLevelsResult = numpy.linspace(1026.5, 1028., 7)

# colormap for differences
colormapNameDifference = balance
# the type of norm used in the colormap
normTypeDifference = linear
# A dictionary with keywords for the norm
normArgsDifference = {'vmin': -0.3, 'vmax': 0.3}
# place the ticks automatically by default
# colorbarTicksDifference = numpy.linspace(-0.3, 0.3, 9)
contourLevelsDifference = numpy.linspace(-0.3, 0.3, 9)


[soseZonalVelocityTransects]
## options related to plotting SOSE transects of zonal velocity

# colormap for model/observations
colormapNameResult = delta
# color indices into colormapName for filled contours
# the type of norm used in the colormap
normTypeResult = linear
# A dictionary with keywords for the norm
normArgsResult = {'vmin': -0.2, 'vmax': 0.2}
# determine the ticks automatically by default, uncomment to specify
# colorbarTicksResult = numpy.linspace(-0.2, 0.2, 9)
contourLevelsResult = numpy.linspace(-0.2, 0.2, 9)

# colormap for differences
colormapNameDifference = balance
# the type of norm used in the colormap
normTypeDifference = linear
# A dictionary with keywords for the norm
normArgsDifference = {'vmin': -0.2, 'vmax': 0.2}
# determine the ticks automatically by default, uncomment to specify
# colorbarTicksDifference = numpy.linspace(-0.2, 0.2, 9)
contourLevelsDifference = numpy.linspace(-0.2, 0.2, 9)


[soseMeridionalVelocityTransects]
## options related to plotting SOSE transects of meridional velocity

# colormap for model/observations
colormapNameResult = delta
# color indices into colormapName for filled contours
# the type of norm used in the colormap
normTypeResult = linear
# A dictionary with keywords for the norm
normArgsResult = {'vmin': -0.2, 'vmax': 0.2}
# determine the ticks automatically by default, uncomment to specify
# colorbarTicksResult = numpy.linspace(-0.2, 0.2, 9)
contourLevelsResult = numpy.linspace(-0.2, 0.2, 9)

# colormap for differences
colormapNameDifference = balance
# the type of norm used in the colormap
normTypeDifference = linear
# A dictionary with keywords for the norm
normArgsDifference = {'vmin': -0.2, 'vmax': 0.2}
# determine the ticks automatically by default, uncomment to specify
# colorbarTicksDifference = numpy.linspace(-0.2, 0.2, 9)
contourLevelsDifference = numpy.linspace(-0.2, 0.2, 9)


[soseVelocityMagnitudeTransects]
## options related to plotting SOSE transects of velocity magnitude

# colormap for model/observations
colormapNameResult = ice
# color indices into colormapName for filled contours
# the type of norm used in the colormap
normTypeResult = linear
# A dictionary with keywords for the norm
normArgsResult = {'vmin': 0, 'vmax': 0.2}
# determine the ticks automatically by default, uncomment to specify
# colorbarTicksResult = numpy.linspace(0, 0.2, 9)
contourLevelsResult = numpy.linspace(0, 0.2, 9)

# colormap for differences
colormapNameDifference = balance
# the type of norm used in the colormap
normTypeDifference = linear
# A dictionary with keywords for the norm
normArgsDifference = {'vmin': -0.2, 'vmax': 0.2}
# determine the ticks automatically by default, uncomment to specify
# colorbarTicksDifference = numpy.linspace(-0.2, 0.2, 9)
contourLevelsDifference = numpy.linspace(-0.2, 0.2, 9)
The options minLat and maxLat determine the start and end of each
meridional transect (in degrees). The option longitudes is a list or
numpy array of longitudes for each transect, e.g.:
longitudes = numpy.linspace(0, 330, 12)
produces 12 transects spaced every 30°.
Note
SOSE’s domain extends only to 25°S, so maxLat should typically be
less than -25.
The user can select only to plot a subset of the supported fields by adding
only the desired field names to fieldList. The default value shows the
list of all available fields.
Note
Because velocityMagnitude is computed internally rather than being stored
as a separate field with the other SOSE output, it is not possible to plot
velocityMagnitude without also plotting zonalVelocity and
meridionalVelocity.
Ater the soseTransects section, there is a section for each supported field
specifying the information related to the colormap.
- For details on remaining configuration options, see:
Observations
2005-2010 climatology from SOSE the Southern Ocean State Estimate (SOSE)
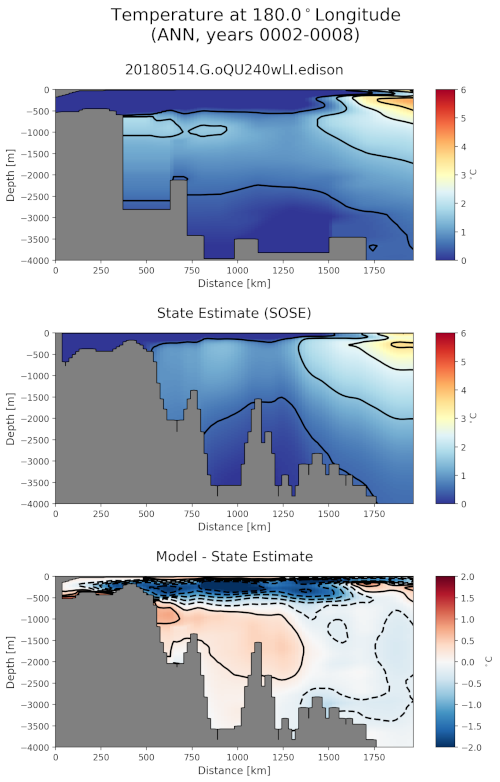
Example Result