climatologyMapSose
An analysis task for comparing fields at various depths against results from the Southern Ocean State Estimate (SOSE).
Component and Tags:
component: ocean
tags: climatology, horizontalMap, sose, publicObs, temperature, salinity,
      potentialDensity, mixedLayerDepth, zonalVelocity, meridionalVelocity,
      velocityMagnitude
Configuration Options
The following configuration options are available for this task:
[climatologyMapSose]
## options related to plotting climatology maps of Antarctic fields at various
## levels, including the sea floor against reference model results and SOSE
## reanalysis data

# comparison grid(s)
# only the Antarctic really makes sense but lat-lon could technically work.
comparisonGrids = ['antarctic']

# Months or seasons to plot (Jan, Feb, Mar, Apr, May, Jun, Jul, Aug, Sep, Oct,
# Nov, Dec, JFM, AMJ, JAS, OND, ANN)
seasons =  ['ANN','JFM','JAS']

# list of depths in meters (positive up) at which to analyze, 'top' for the
# sea surface, 'bot' for the sea floor
depths = ['top', -200, -400, -600, -800, 'bot']

# a list of fields top plot for each transect.  All supported fields are listed
# below
fieldList = ['temperature', 'salinity', 'potentialDensity', 'mixedLayerDepth',
             'zonalVelocity', 'meridionalVelocity', 'velocityMagnitude']

# set the suffix for files, e.g. if you want to use a different comparison
# grid from the default
fileSuffix = 6000.0x6000.0km_10.0km_Antarctic_stereo_20180710

[climatologyMapSoseTemperature]
## options related to plotting climatology maps of Antarctic
## potential temperature at various levels, including the sea floor against
## reference model results and SOSE reanalysis data

# colormap for model/observations
colormapNameResult = RdYlBu_r
# the type of norm used in the colormap
normTypeResult = linear
# A dictionary with keywords for the norm
normArgsResult = {'vmin': -2., 'vmax': 2.}
# place the ticks automatically by default
# colorbarTicksResult = numpy.linspace(-2., 2., 9)

# colormap for differences
colormapNameDifference = balance
# the type of norm used in the colormap
normTypeDifference = linear
# A dictionary with keywords for the norm
normArgsDifference = {'vmin': -2., 'vmax': 2.}
# place the ticks automatically by default
# colorbarTicksDifference = numpy.linspace(-2., 2., 9)


[climatologyMapSoseSalinity]
## options related to plotting climatology maps of Antarctic
## salinity at various levels, including the sea floor against
## reference model results and SOSE reanalysis data

# colormap for model/observations
colormapNameResult = haline
# the type of norm used in the colormap
normTypeResult = linear
# A dictionary with keywords for the norm
normArgsResult = {'vmin': 33.8, 'vmax': 35.0}
# place the ticks automatically by default
# colorbarTicksResult = numpy.linspace(34.2, 35.2, 9)

# colormap for differences
colormapNameDifference = balance
# the type of norm used in the colormap
normTypeDifference = linear
# A dictionary with keywords for the norm
normArgsDifference = {'vmin': -0.5, 'vmax': 0.5}
# place the ticks automatically by default
# colorbarTicksDifference = numpy.linspace(-0.5, 0.5, 9)


[climatologyMapSosePotentialDensity]
## options related to plotting climatology maps of Antarctic
## potential density at various levels, including the sea floor against
## reference model results and SOSE reanalysis data

# colormap for model/observations
colormapNameResult = Spectral_r
# the type of norm used in the colormap
normTypeResult = linear
# A dictionary with keywords for the norm
normArgsResult = {'vmin': 1026.5, 'vmax': 1028.}
# place the ticks automatically by default
# colorbarTicksResult = numpy.linspace(1026., 1028., 9)

# colormap for differences
colormapNameDifference = balance
# the type of norm used in the colormap
normTypeDifference = linear
# A dictionary with keywords for the norm
normArgsDifference = {'vmin': -0.3, 'vmax': 0.3}
# place the ticks automatically by default
# colorbarTicksDifference = numpy.linspace(-0.3, 0.3, 9)


[climatologyMapSoseMixedLayerDepth]
## options related to plotting climatology maps of Antarctic
## mixed layer depth against reference model results and SOSE reanalysis data

# colormap for model/observations
colormapNameResult = viridis
# color indices into colormapName for filled contours
# the type of norm used in the colormap
normTypeResult = log
# A dictionary with keywords for the norm
normArgsResult = {'vmin': 10., 'vmax': 300.}
# specify the ticks
colorbarTicksResult = [10, 20, 40, 60, 80, 100, 200, 300]

# colormap for differences
colormapNameDifference = balance
# the type of norm used in the colormap
normTypeDifference = symLog
# A dictionary with keywords for the norm
normArgsDifference = {'linthresh': 10., 'linscale': 0.5, 'vmin': -200.,
                      'vmax': 200.}
colorbarTicksDifference = [-200., -100., -50., -20., -10., 0., 10., 20., 50., 100., 200.]


[climatologyMapSoseZonalVelocity]
## options related to plotting climatology maps of Antarctic
## zonal velocity against reference model results and SOSE reanalysis data

# colormap for model/observations
colormapNameResult = delta
# color indices into colormapName for filled contours
# the type of norm used in the colormap
normTypeResult = linear
# A dictionary with keywords for the norm
normArgsResult = {'vmin': -0.2, 'vmax': 0.2}
# determine the ticks automatically by default, uncomment to specify
# colorbarTicksResult = numpy.linspace(-0.2, 0.2, 9)

# colormap for differences
colormapNameDifference = balance
# the type of norm used in the colormap
normTypeDifference = linear
# A dictionary with keywords for the norm
normArgsDifference = {'vmin': -0.2, 'vmax': 0.2}
# determine the ticks automatically by default, uncomment to specify
# colorbarTicksDifference = numpy.linspace(-0.2, 0.2, 9)


[climatologyMapSoseMeridionalVelocity]
## options related to plotting climatology maps of Antarctic
## meridional against reference model results and SOSE reanalysis data

# colormap for model/observations
colormapNameResult = delta
# color indices into colormapName for filled contours
# the type of norm used in the colormap
normTypeResult = linear
# A dictionary with keywords for the norm
normArgsResult = {'vmin': -0.2, 'vmax': 0.2}
# determine the ticks automatically by default, uncomment to specify
# colorbarTicksResult = numpy.linspace(-0.2, 0.2, 9)

# colormap for differences
colormapNameDifference = balance
# the type of norm used in the colormap
normTypeDifference = linear
# A dictionary with keywords for the norm
normArgsDifference = {'vmin': -0.2, 'vmax': 0.2}
# determine the ticks automatically by default, uncomment to specify
# colorbarTicksDifference = numpy.linspace(-0.2, 0.2, 9)


[climatologyMapSoseVelocityMagnitude]
## options related to plotting climatology maps of Antarctic
## meridional against reference model results and SOSE reanalysis data

# colormap for model/observations
colormapNameResult = ice
# color indices into colormapName for filled contours
# the type of norm used in the colormap
normTypeResult = linear
# A dictionary with keywords for the norm
normArgsResult = {'vmin': 0, 'vmax': 0.2}
# determine the ticks automatically by default, uncomment to specify
# colorbarTicksResult = numpy.linspace(0, 0.2, 9)

# colormap for differences
colormapNameDifference = balance
# the type of norm used in the colormap
normTypeDifference = linear
# A dictionary with keywords for the norm
normArgsDifference = {'vmin': -0.2, 'vmax': 0.2}
# determine the ticks automatically by default, uncomment to specify
# colorbarTicksDifference = numpy.linspace(-0.2, 0.2, 9)
There is a section for options that apply to all SOSE climatology maps and one for each field supported for specifying the color map.
The option depths is a list of (approximate) depths at which to sample
the potential temperature field. A value of 'top' indicates the sea
surface (or the ice-ocean interface under ice shelves) while a value of
'bot' indicates the seafloor.
The user can select only to plot a subset of the supported fields by adding
only the desired field names to fieldList. The default value shows the
list of all available fields.
SOSE data for the full Southern Ocean
The default SOSE data is on a 6,000 x 6,000 km grid focused on the Antarctic continental shelf. An alternative data set is available on a 10,000 x 10,000 km grid. These data can be downloaded directly from the data repository or by calling:
download_analysis_data -o /output/path/for/diagnostics -d sose_10000km
where the output path is the baseDirectory given in the diagnostics
section of the config file (see Diagnostics). The data set is not
included in the default download because of its large size (~27 GB).
Climatologies can be plotted with these data by setting:
fileSuffix = 10000.0x10000.0km_10.0km_Antarctic_stereo_20190603
- For more details, see:
State Estimate
2005-2010 climatology from SOSE the Southern Ocean State Estimate (SOSE)
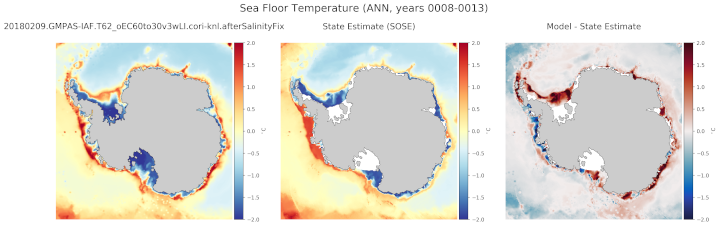
Example Result