climatologyMapSeaIceConcSH
An analysis task for plotting maps of Antarctic sea ice concentration against observations.
Component and Tags:
component: seaIce
tags: climatology, horizontalMap, seaIceConc, publicObs
Configuration Options
The following configuration options are available for this task:
[climatologyMapSeaIceConcSH]
## options related to plotting horizontally remapped climatologies of
## sea ice concentration against reference model results and observations
## in the southern hemisphere (SH)

# colormap for model/observations
colormapNameResult = ice
# color indices into colormapName for filled contours
colormapIndicesResult = [20, 80, 110, 140, 170, 200, 230, 255]
# colormap levels/values for contour boundaries
colorbarLevelsResult = [0.15, 0.3, 0.5, 0.7, 0.8, 0.85, 0.9, 0.95, 1]

# colormap for differences
colormapNameDifference = balance
# color indices into colormapName for filled contours
colormapIndicesDifference = [0, 32, 64, 96, 112, 128, 128, 144, 160, 192,
                             224, 255]
# colormap levels/values for contour boundaries
colorbarLevelsDifference = [-1., -0.8, -0.6, -0.4, -0.2, -0.1, 0, 0.1, 0.2,
                            0.4, 0.6, 0.8, 1.]

# Months or seasons to plot (These should be left unchanged, since
# observations are only available for these seasons)
seasons =  ['DJF', 'JJA']

# comparison grid(s) ('latlon', 'antarctic') on which to plot analysis
comparisonGrids = ['latlon']

# reference lat/lon for sea ice plots in the northern hemisphere
minimumLatitude = -50
referenceLongitude = 180

# a list of prefixes describing the sources of the observations to be used
observationPrefixes = ['NASATeam', 'Bootstrap']

# arrange subplots vertically?
vertical = False

# observations files
concentrationNASATeamSH_DJF = SSMI/NASATeam_NSIDC0051/SSMI_NASATeam_gridded_concentration_SH_djf.interp0.5x0.5_20180710.nc
concentrationNASATeamSH_JJA = SSMI/NASATeam_NSIDC0051/SSMI_NASATeam_gridded_concentration_SH_jja.interp0.5x0.5_20180710.nc
concentrationBootstrapSH_DJF = SSMI/Bootstrap_NSIDC0079/SSMI_Bootstrap_gridded_concentration_SH_djf.interp0.5x0.5_20180710.nc
concentrationBootstrapSH_JJA = SSMI/Bootstrap_NSIDC0079/SSMI_Bootstrap_gridded_concentration_SH_jja.interp0.5x0.5_20180710.nc
The option minimumLatitude determines what the northernmost latitude (in
degrees) included in the plot will be. The option referenceLongitude
defines which longitude will be at the bottom of the plot.
By default, plots are produced comparing modeled sea ice concentration against
both observations produced with both the NasaTeam and Bootstrap
algorithms. By altering observationPrefixes, you can select only one
(or none) of these.
The option vertical = True can be used to plot 3 panels one above another
(resulting in a tall, thin image) rather than next to each other, the default
(resulting in a short, wide image).
The ability to modify observations files pointed to by
concentrationNASATeamSH_DJF, concentrationNASATeamSH_JJA,
concentrationBootstrapSH_DJF and concentrationBootstrapSH_JJA is
provided for debugging purposes and these options
should typically remain unchanged.
- For details on the remaining configration options, see:
Observations
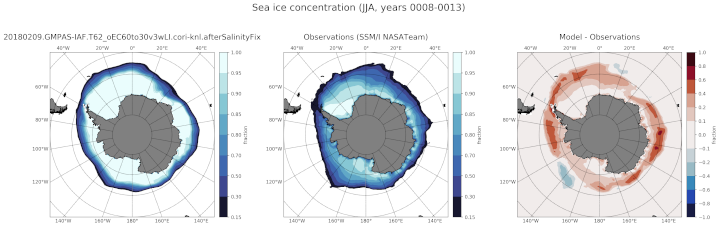
Example Result