climatologyMapBGC
An analysis task for comparison of global maps of biogeochemistry (BGC) fields against observations.
Component and Tags:
component: ocean
tags: climatology, horizontalMap, BGC, PO4, NO3, SiO3, CO2_gas_flux, pH_3D,
      DIC, ALK, O2, pCO2surface, Chl
Configuration Options
The following configuration options are available for this task:
[climatologyMapBGC]
## options related to plotting climatology mpas of BGC
# Variables to plot:
# pH : 'pH_3D'
# DIC : 'DIC'
# ALK : 'ALK'
# PO4 : 'PO4'
# NO3 : 'NO3'
# SiO3 : 'SiO3'
# CO2 flux : 'CO2_gas_flux'
# O2 : 'O2'
variables = ['PO4', 'NO3', 'SiO3', 'CO2_gas_flux', 'pH_3D', 'DIC', 'ALK',
'O2', 'pCO2surface', 'Chl']
# Times for comparison times (Jan, Feb, Mar, Apr, May, Jun, Jul, Aug, Sep,
# Oct, Nov, Dec, JFM, AMJ, JAS, OND, ANN)
seasons = ['ANN', 'JFM', 'JAS']
# comparison grid(s) ('latlon', 'antarctic') on which to plot analysis
comparisonGrids = ['latlon', 'antarctic']
# Whether to compare to preindustrial observations that are available.
preindustrial = False
[climatologyMapBGC_PO4]
# Colormap for climatology
colormapNameResult = dense
# Colormap for clim - obs difference
colormapNameDifference = balance
# linear vs. log scaling for climatology
normTypeResult = linear
# Colorbar bounds for climatology
normArgsResult = {'vmin': 0, 'vmax': 2.5}
# linear vs. log scaling for obs
normTypeDifference = linear
# Colorbar bounds for obs
normArgsDifference = {'vmin': -1, 'vmax': 1}
# BGC property units
units = mmol m$^{-3}$
# Prefix to variable name in MPAS-O output
filePrefix = timeMonthly_avg_ecosysTracers_
# Acronym/label for observational dataset
observationsLabel = WOA
# Acronym/label for gallery variable (can be different from MPAS name)
galleryLabel = PO4
[climatologyMapBGC_NO3]
colormapNameResult = dense
colormapNameDifference = balance
normTypeResult = linear
normArgsResult = {'vmin': 0, 'vmax': 35.0}
normTypeDifference = linear
normArgsDifference = {'vmin': -10, 'vmax': 10}
units = mmol m$^{-3}$
filePrefix = timeMonthly_avg_ecosysTracers_
observationsLabel = WOA
galleryLabel = NO3
[climatologyMapBGC_SiO3]
colormapNameResult = dense
colormapNameDifference = balance
normTypeResult = linear
normArgsResult = {'vmin': 0, 'vmax': 80}
normTypeDifference = linear
normArgsDifference = {'vmin': -20, 'vmax': 20}
units = mmol m$^{-3}$
filePrefix = timeMonthly_avg_ecosysTracers_
observationsLabel = WOA
galleryLabel = SiO3
[climatologyMapBGC_CO2_gas_flux]
colormapNameResult = BrBG_r
colormapNameDifference = balance
normTypeResult = linear
normArgsResult = {'vmin': -5, 'vmax': 5}
normTypeDifference = linear
normArgsDifference = {'vmin': -5, 'vmax': 5}
units = mol m$^{-2}$ yr$^{-1}$
filePrefix = timeMonthly_avg_
observationsLabel = SOM-FFNv2016
galleryLabel = CO2 Flux
[climatologyMapBGC_O2]
colormapNameResult = matter
colormapNameDifference = balance
normTypeResult = linear
normArgsResult = {'vmin': 2, 'vmax': 8}
normTypeDifference = linear
normArgsDifference = {'vmin': -2, 'vmax': 2}
units = mL/L
filePrefix = timeMonthly_avg_ecosysTracers_
observationsLabel = WOA
galleryLabel = O2
[climatologyMapBGC_pH_3D]
colormapNameResult = PuBuGn_r
colormapNameDifference = balance
normTypeResult = linear
normArgsResult = {'vmin': 8, 'vmax': 8.2}
normTypeDifference = linear
normArgsDifference = {'vmin': -0.2, 'vmax': 0.2}
units =
filePrefix = timeMonthly_avg_ecosys_diag_
observationsLabel = GLODAPv2
galleryLabel = pH
[climatologyMapBGC_DIC]
colormapNameResult = YlGnBu
colormapNameDifference = balance
normTypeResult = linear
normArgsResult = {'vmin': 1900, 'vmax': 2300}
normTypeDifference = linear
normArgsDifference = {'vmin': -100, 'vmax': 100}
units = mmol m$^{-3}$
filePrefix = timeMonthly_avg_ecosysTracers_
observationsLabel = GLODAPv2
galleryLabel = DIC
[climatologyMapBGC_ALK]
colormapNameResult = PuBuGn
colormapNameDifference = balance
normTypeResult = linear
normArgsResult = {'vmin': 2150, 'vmax': 2450}
normTypeDifference = linear
normArgsDifference = {'vmin': -100, 'vmax': 100}
units = meq m$^{-3}$
filePrefix = timeMonthly_avg_ecosysTracers_
observationsLabel = GLODAPv2
galleryLabel = Alkalinity
[climatologyMapBGC_pCO2surface]
colormapNameResult = viridis
colormapNameDifference = balance
normTypeResult = linear
normArgsResult = {'vmin': 300, 'vmax': 450}
normTypeDifference = linear
normArgsDifference = {'vmin': -50, 'vmax': 50}
units = $\mu$atm
filePrefix = timeMonthly_avg_ecosys_diag_
observationsLabel = SOM-FFNv2016
galleryLabel = pCO2
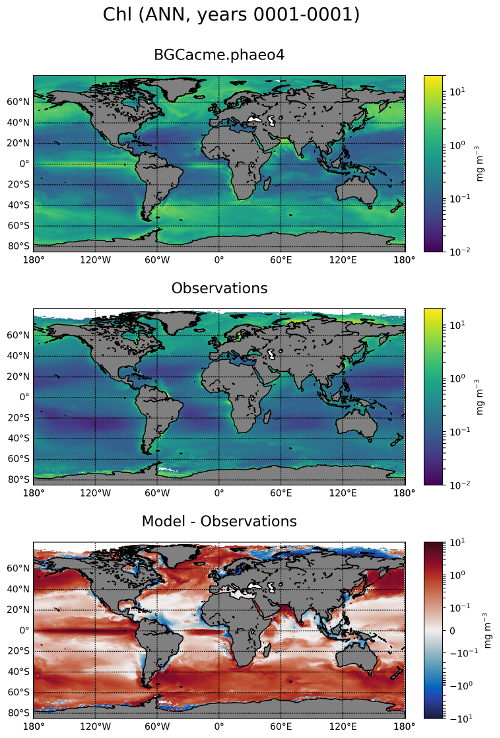
[climatologyMapBGC_Chl]
colormapNameResult = viridis
colormapNameDifference = balance
normTypeResult = log
normArgsResult = {'vmin': 0.01, 'vmax': 20}
normTypeDifference = symLog
normArgsDifference = {'linthresh': 0.1, 'vmin': -10, 'vmax': 10}
units = mg m$^{-3}$
filePrefix = timeMonthly_avg_ecosysTracers_
observationsLabel = SeaWIFS
galleryLabel = Chlorophyll
- For more details, see:
Observations
Example Result