climatologyMapAntarcticMelt
An analysis task for comparison of Antarctic maps of melt rates against observations from Paolo et al. (2023).
Component and Tags:
component: ocean
tags: climatology, horizontalMap, meltRate, landIceCavities
Configuration Options
The following configuration options are available for this task:
[climatologyMapAntarcticMelt]
## options related to plotting horizontally regridded maps of Antarctic
## sub-ice-shelf melt rates against control model results and observations

# comparison grid(s)
# only the Antarctic really makes sense but lat-lon could technically work.
comparisonGrids = ['antarctic']

# Months or seasons to plot (Jan, Feb, Mar, Apr, May, Jun, Jul, Aug, Sep, Oct,
# Nov, Dec, JFM, AMJ, JAS, OND, ANN)
seasons =  ['JFM', 'JAS', 'ANN']

# colormap for model/observations
colormapNameResult = erdc_iceFire_H
# whether the colormap is indexed or continuous
colormapTypeResult = continuous
# the type of norm used in the colormap
normTypeResult = symLog
# A dictionary with keywords for the norm
normArgsResult = {'linthresh': 1., 'linscale': 0.5, 'vmin': -100.,
                  'vmax': 100.}
colorbarTicksResult = [-100., -50., -20., -10., -5., -2., -1., 0., 1., 2., 5.,
                       10., 20., 50., 100.]

# colormap for differences
colormapNameDifference = balance
# whether the colormap is indexed or continuous
colormapTypeDifference = continuous
# the type of norm used in the colormap
normTypeDifference = symLog
# A dictionary with keywords for the norm
normArgsDifference = {'linthresh': 1., 'linscale': 0.5, 'vmin': -100.,
                      'vmax': 100.}
colorbarTicksDifference = [-100., -50., -20., -10., -5., -2., -1., 0., 1., 2.,
                           5., 10., 20., 50., 100.]

# make a tables of mean melt rates and melt fluxes for individual ice shelves?
makeTables = False

# If making tables, which ice shelves?  This is a list of ice shelves or
# ['all'] for all 106 ice shelves and regions.
iceShelvesInTable = []
The option meltTables determines if tables of mean melt rates, averaged
over each ice shelf or region, are computed. iceShelvesInTable is a list
of the ice shelf or region names to include in the table. A value of 'all'
indicates that all 106 ice shelves and regions will be included in the table.
The table is in csv format and can be found in the tables subdirectory.
- For more details, see:
Observations
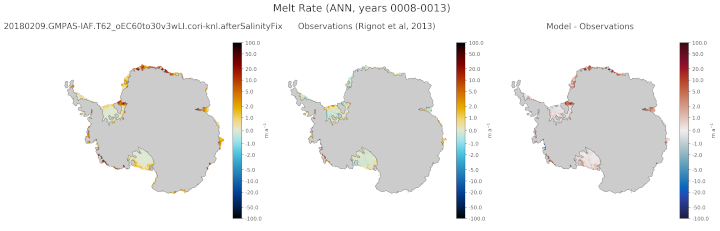
Example Result