climatologyMapSchmidtko
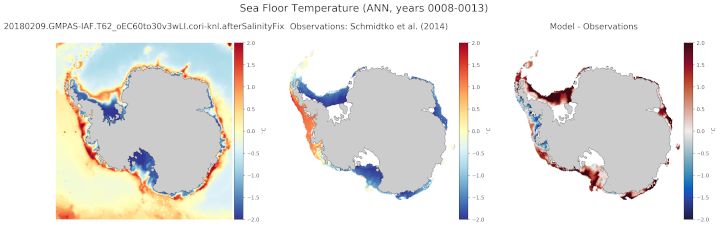
An analysis task for comparison of Antarctic maps of seafloor potential temperature, salinity and potential density against observations from Schmidtko et al. (2014).
Component and Tags:
component: ocean
tags: climatology, horizontalMap, temperature, salinity, potentialDensity
Configuration Options
The following configuration options are available for this task:
[climatologyMapSchmidtko]
## options related to plotting climatology maps of Antarctic fields at the
## seafloor and comparing them against data from Schmidtko et al. (2014)

# comparison grid(s)
# only the Antarctic really makes sense but lat-lon could technically work.
comparisonGrids = ['antarctic']

# Months or seasons to plot (Jan, Feb, Mar, Apr, May, Jun, Jul, Aug, Sep, Oct,
# Nov, Dec, JFM, AMJ, JAS, OND, ANN)
seasons =  ['ANN','JFM','JAS']

[climatologyMapSchmidtkoTemperature]
## options related to plotting climatology maps of potential temperature at the
## seafloor and comparing them against data from Schmidtko et al. (2014)

# colormap for model/observations
colormapNameResult = RdYlBu_r
# the type of norm used in the colormap
normTypeResult = linear
# A dictionary with keywords for the norm
normArgsResult = {'vmin': -2., 'vmax': 2.}
# place the ticks automatically by default
# colorbarTicksResult = numpy.linspace(-2., 2., 9)

# colormap for differences
colormapNameDifference = balance
# the type of norm used in the colormap
normTypeDifference = linear
# A dictionary with keywords for the norm
normArgsDifference = {'vmin': -2., 'vmax': 2.}
# place the ticks automatically by default
# colorbarTicksDifference = numpy.linspace(-2., 2., 9)

[climatologyMapSchmidtkoSalinity]
## options related to plotting climatology maps of salinity at the
## seafloor and comparing them against data from Schmidtko et al. (2014)

# colormap for model/observations
colormapNameResult = haline
# the type of norm used in the colormap
normTypeResult = linear
# A dictionary with keywords for the norm
normArgsResult = {'vmin': 33.8, 'vmax': 35.0}
# place the ticks automatically by default
# colorbarTicksResult = numpy.linspace(33.8, 35.0, 9)

# colormap for differences
colormapNameDifference = balance
# the type of norm used in the colormap
normTypeDifference = linear
# A dictionary with keywords for the norm
normArgsDifference = {'vmin': -0.5, 'vmax': 0.5}
# place the ticks automatically by default
# colorbarTicksDifference = numpy.linspace(-0.5, 0.5, 9)

[climatologyMapSchmidtkoPotentialDensity]
## options related to plotting climatology maps of potential density at the
## seafloor and comparing them against data from Schmidtko et al. (2014)

# colormap for model/observations
colormapNameResult = Spectral_r
# the type of norm used in the colormap
normTypeResult = linear
# A dictionary with keywords for the norm
normArgsResult = {'vmin': 1026.5, 'vmax': 1028.}
# place the ticks automatically by default
# colorbarTicksResult = numpy.linspace(1026.5, 1028., 9)

# colormap for differences
colormapNameDifference = balance
# the type of norm used in the colormap
normTypeDifference = linear
# A dictionary with keywords for the norm
normArgsDifference = {'vmin': -0.3, 'vmax': 0.3}
# place the ticks automatically by default
# colorbarTicksDifference = numpy.linspace(-0.3, 0.3, 9)
- For more details, see:
Observations
Example Result