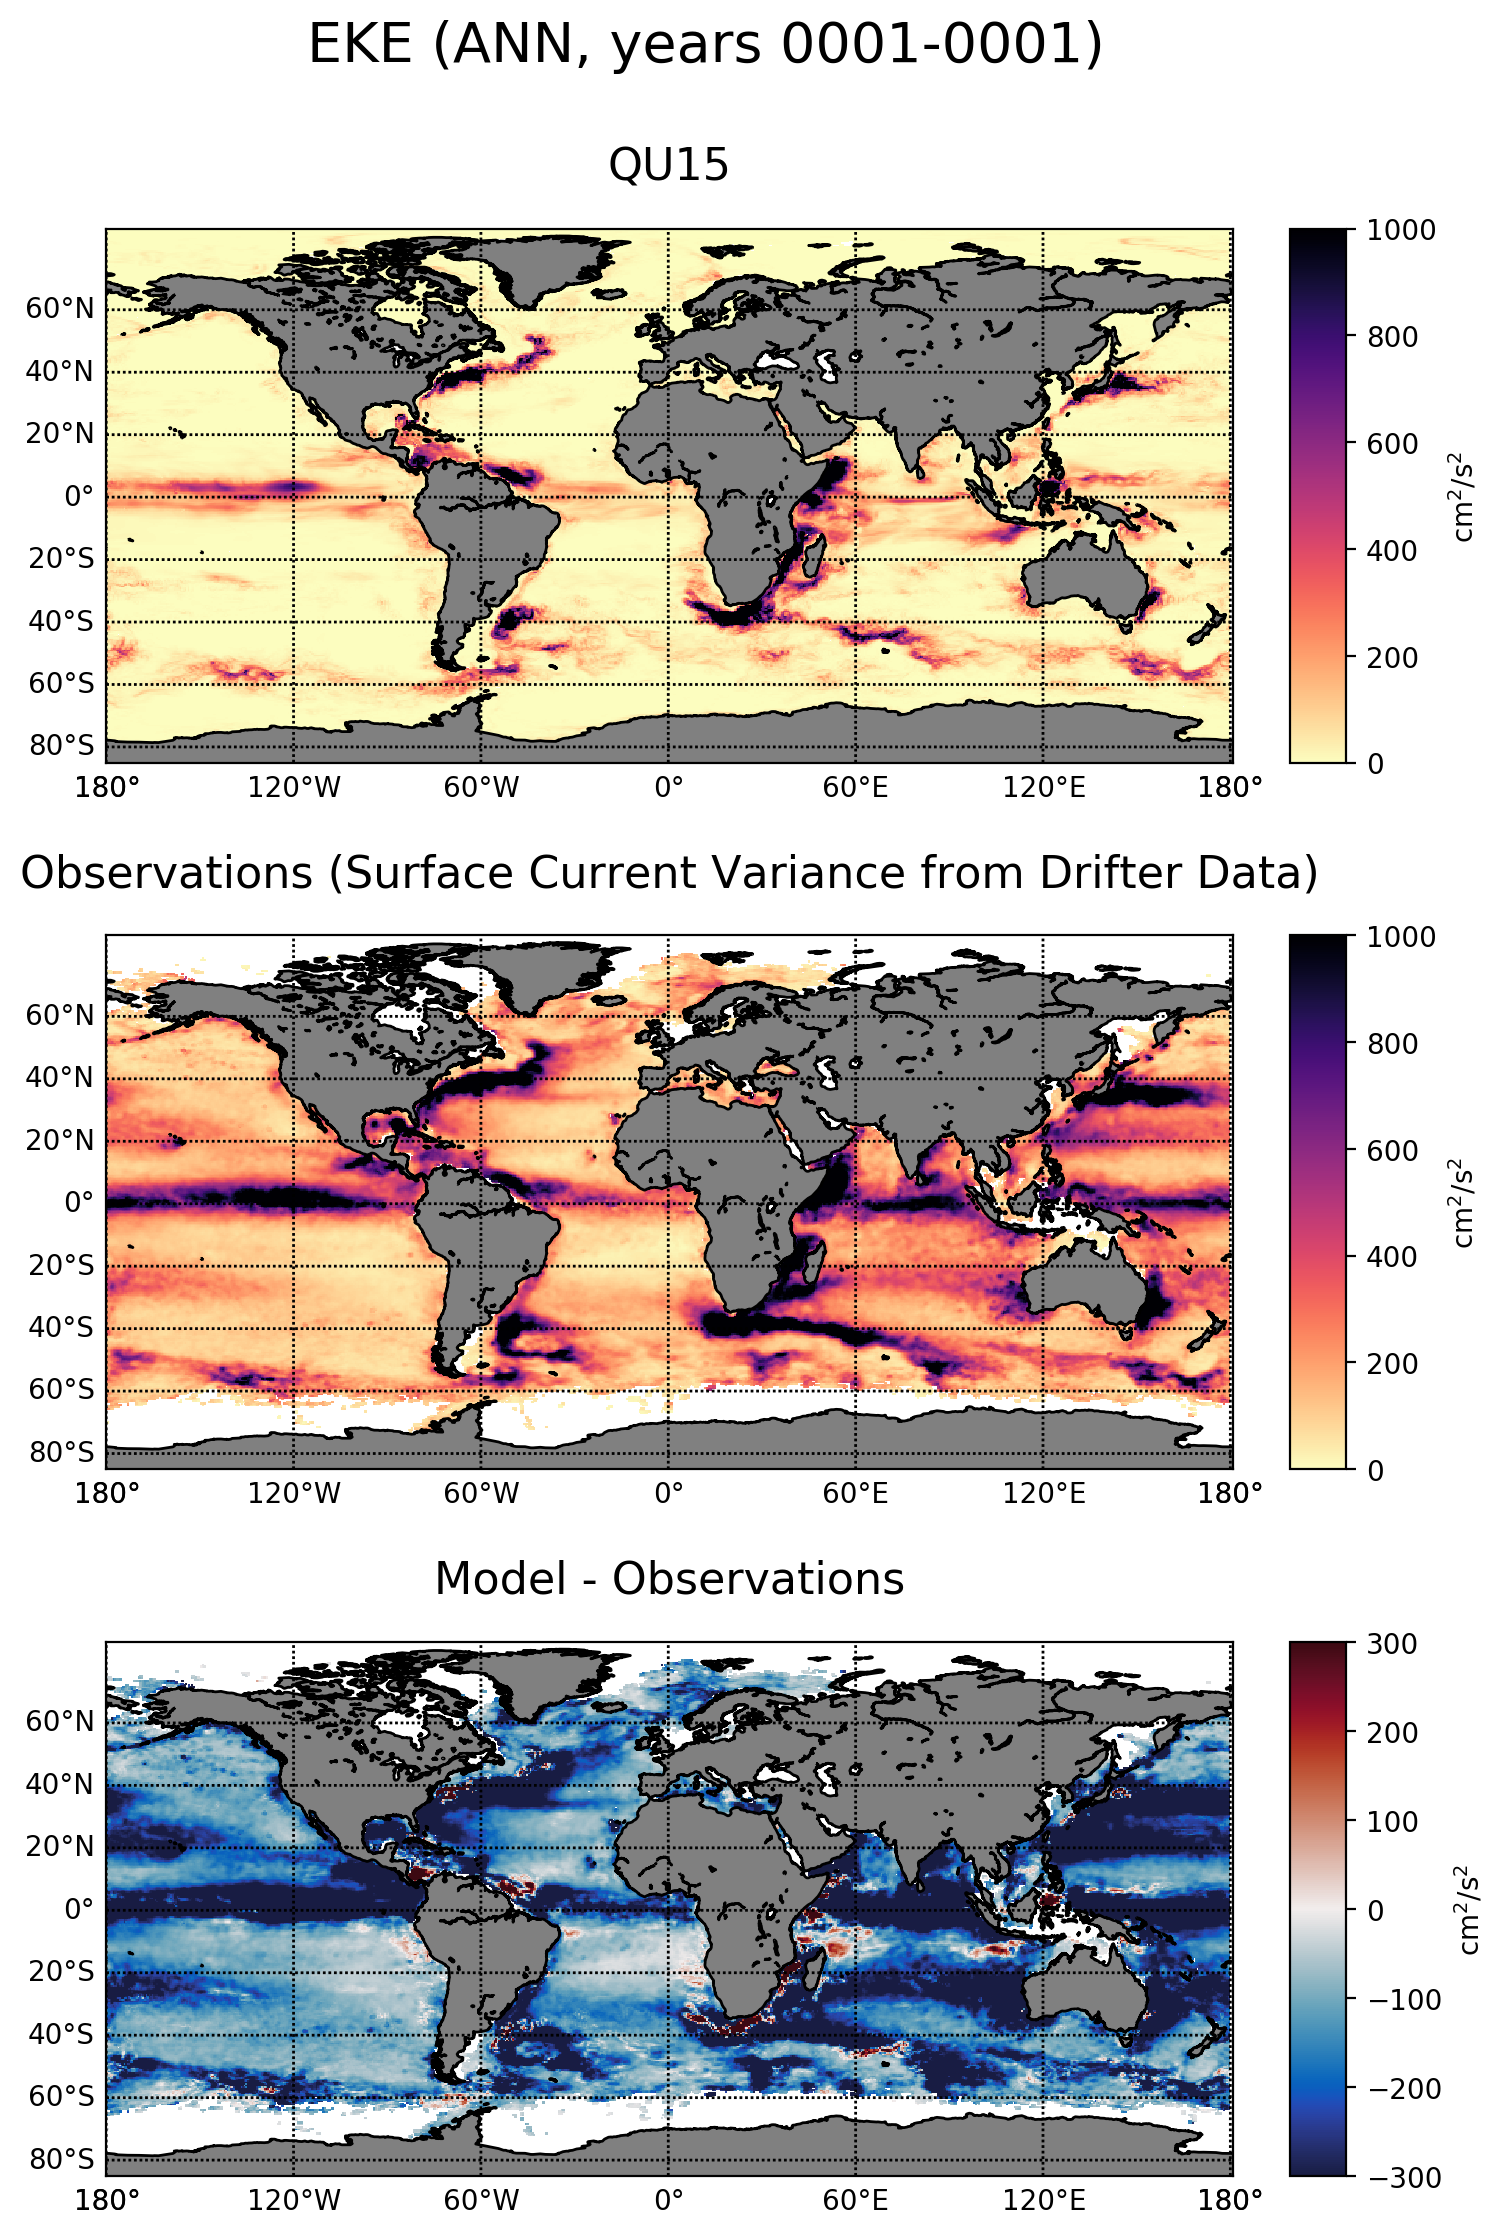
climatologyMapEKE
An analysis task for comparison of global maps of sea surface height (SSH) with zero mean against observations. The mean has been subtracted because the initial sea level is somewhat arbitrary and will lead to a systematic offset when compared with the observations.
Component and Tags:
component: ocean
tags: climatology, horizontalMap, eke, publicObs
Configuration Options
The following configuration options are available for this task:
[climatologyMapEKE]
## options related to plotting horizontally remapped climatologies of
## eddy kinetic energy (EKE) against reference model results and observations

# colormap for model/observations
colormapNameResult = magma_r
# the type of norm used in the colormap
normTypeResult = linear
# A dictionary with keywords for the norm
normArgsResult = {'vmin': 0., 'vmax': 1000.}
# place the ticks automatically by default
# colorbarTicksResult = numpy.linspace(-2., 2., 9)

# colormap for differences
colormapNameDifference = balance
# the type of norm used in the colormap
normTypeDifference = linear
# A dictionary with keywords for the norm
normArgsDifference = {'vmin': -300., 'vmax': 300.}
# place the ticks automatically by default
# colorbarTicksDifference = numpy.linspace(-2., 2., 9

# Months or seasons to plot (Jan, Feb, Mar, Apr, May, Jun, Jul, Aug, Sep, Oct,
# Nov, Dec, JFM, AMJ, JAS, OND, ANN)
seasons =  ['ANN']

# comparison grid(s) ('latlon', 'antarctic') on which to plot analysis
comparisonGrids = ['latlon']
- For more details, see:
Observations
Example Result